Main article: 1972 United States presidential election
The 1972 United States presidential election in Montana took place on November 7, 1972, and was part of the 1972 United States presidential election . Voters chose four representatives, or electors to the Electoral College , who voted for president and vice president .
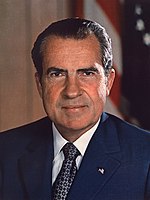
Montana strongly voted for the Republican nominee, President Richard Nixon , over the Democratic nominee, Senator George McGovern . Nixon won Montana by a margin of 20.08%, making Montana around 4% more Democratic than the nation at large; McGovern's vote share was 0.4% higher than it was nationally. This was the first time since 1928 that Sheridan County voted Republican. As of the 2024 U.S. presidential election , this is the last time Montana shifted in favor of the incumbent President's party, as in the 12 subsequent presidential elections after 1972, it would shift away from every incumbent President's party.
Results
Results by county
County
Richard Nixon
George McGovern
John G. Schmitz
Margin
Total votes cast
#
%
#
%
#
%
#
%
Beaverhead
2,460
71.99%
775
22.68%
182
5.33%
1,685
49.31%
3,417
Big Horn
2,148
56.17%
1,552
40.59%
124
3.24%
596
15.58%
3,824
Blaine
1,513
54.44%
1,151
41.42%
115
4.14%
362
13.02%
2,779
Broadwater
916
66.57%
411
29.87%
49
3.56%
505
36.70%
1,376
Carbon
2,378
61.91%
1,292
33.64%
171
4.45%
1,086
28.27%
3,841
Carter
726
73.86%
218
22.18%
39
3.97%
508
51.68%
983
Cascade
16,159
52.40%
12,899
41.83%
1,778
5.77%
3,260
10.57%
30,836
Chouteau
2,027
59.64%
1,149
33.80%
223
6.56%
878
25.84%
3,399
Custer
3,486
63.31%
1,875
34.05%
145
2.63%
1,611
29.26%
5,506
Daniels
973
61.82%
570
36.21%
31
1.97%
403
25.61%
1,574
Dawson
3,207
63.96%
1,685
33.61%
122
2.43%
1,522
30.35%
5,014
Deer Lodge
2,373
35.93%
3,979
60.25%
252
3.82%
-1,606
-24.32%
6,604
Fallon
1,034
64.46%
531
33.10%
39
2.43%
503
31.36%
1,604
Fergus
4,082
67.48%
1,652
27.31%
315
5.21%
2,430
40.17%
6,049
Flathead
10,417
60.72%
5,412
31.55%
1,327
7.73%
5,005
29.17%
17,156
Gallatin
10,663
66.28%
5,096
31.68%
329
2.05%
5,567
34.60%
16,088
Garfield
695
77.83%
173
19.37%
25
2.80%
522
58.46%
893
Glacier
2,143
56.11%
1,469
38.47%
207
5.42%
674
17.64%
3,819
Golden Valley
359
64.92%
170
30.74%
24
4.34%
189
34.18%
553
Granite
804
62.28%
422
32.69%
65
5.03%
382
29.59%
1,291
Hill
3,759
53.06%
3,061
43.20%
265
3.74%
698
9.86%
7,085
Jefferson
1,281
56.06%
904
39.56%
100
4.38%
377
16.50%
2,285
Judith Basin
961
59.54%
557
34.51%
96
5.95%
404
25.03%
1,614
Lake
4,172
62.09%
2,260
33.64%
287
4.27%
1,912
28.45%
6,719
Lewis and Clark
10,719
61.90%
6,081
35.12%
516
2.98%
4,638
26.78%
17,316
Liberty
808
65.43%
365
29.55%
62
5.02%
443
35.88%
1,235
Lincoln
3,276
52.77%
2,402
38.69%
530
8.54%
874
14.08%
6,208
McCone
854
58.29%
562
38.36%
49
3.34%
292
19.93%
1,465
Madison
1,780
68.78%
669
25.85%
139
5.37%
1,111
42.93%
2,588
Meagher
674
71.55%
230
24.42%
38
4.03%
444
47.13%
942
Mineral
706
49.75%
659
46.44%
54
3.81%
47
3.31%
1,419
Missoula
15,557
51.77%
13,784
45.87%
708
2.36%
1,773
5.90%
30,049
Musselshell
1,202
61.11%
689
35.03%
76
3.86%
513
26.08%
1,967
Park
3,771
63.89%
1,923
32.58%
208
3.52%
1,848
31.31%
5,902
Petroleum
232
71.38%
87
26.77%
6
1.85%
145
44.61%
325
Phillips
1,659
64.88%
828
32.38%
70
2.74%
831
32.50%
2,557
Pondera
1,890
57.41%
1,215
36.91%
187
5.68%
675
20.50%
3,292
Powder River
844
69.35%
267
21.94%
106
8.71%
577
47.41%
1,217
Powell
1,720
59.68%
1,050
36.43%
112
3.89%
670
23.25%
2,882
Prairie
685
68.57%
303
30.33%
11
1.10%
382
38.24%
999
Ravalli
4,611
61.83%
2,480
33.25%
367
4.92%
2,131
28.58%
7,458
Richland
2,645
61.51%
1,438
33.44%
217
5.05%
1,207
28.07%
4,300
Roosevelt
2,304
58.97%
1,464
37.47%
139
3.56%
840
21.50%
3,907
Rosebud
1,486
63.23%
777
33.06%
87
3.70%
709
30.17%
2,350
Sanders
1,779
54.72%
1,197
36.82%
275
8.46%
582
17.90%
3,251
Sheridan
1,500
53.96%
1,197
43.06%
83
2.99%
303
10.90%
2,780
Silver Bow
7,967
39.05%
11,704
57.36%
733
3.59%
-3,737
-18.31%
20,404
Stillwater
1,698
67.95%
716
28.65%
85
3.40%
982
39.30%
2,499
Sweet Grass
1,260
76.00%
350
21.11%
48
2.90%
910
54.89%
1,658
Teton
1,991
59.95%
1,121
33.75%
209
6.29%
870
26.20%
3,321
Toole
1,679
59.64%
897
31.87%
239
8.49%
782
27.77%
2,815
Treasure
377
65.68%
176
30.66%
21
3.66%
201
35.02%
574
Valley
3,210
60.02%
1,973
36.89%
165
3.09%
1,237
23.13%
5,348
Wheatland
761
57.39%
445
33.56%
120
9.05%
316
23.83%
1,326
Wibaux
390
55.48%
283
40.26%
30
4.27%
107
15.22%
703
Yellowstone
25,205
62.64%
13,602
33.80%
1,430
3.55%
11,603
28.84%
40,237
Totals
183,976
57.93%
120,197
37.85%
13,430
4.23%
63,779
20.08%
317,603
Counties that flipped from Democratic to Republican
See also
References
David Leip. "1972 Presidential General Election Results – Montana" . Dave Leip’s Atlas of U.S. Presidential Elections. Retrieved April 9, 2017.
Categories :
Text is available under the Creative Commons Attribution-ShareAlike License. Additional terms may apply.
**DISCLAIMER** We are not affiliated with Wikipedia, and Cloudflare.
The information presented on this site is for general informational purposes only and does not constitute medical advice.
You should always have a personal consultation with a healthcare professional before making changes to your diet, medication, or exercise routine.
AI helps with the correspondence in our chat.
We participate in an affiliate program. If you buy something through a link, we may earn a commission 💕
↑
 County Results


