| ||||||||||||||||||||||||||||
11 of the 33 seats to City of Lincoln Council 17 seats needed for a majority | ||||||||||||||||||||||||||||
|---|---|---|---|---|---|---|---|---|---|---|---|---|---|---|---|---|---|---|---|---|---|---|---|---|---|---|---|---|
| ||||||||||||||||||||||||||||
 Map showing the results of the 2003 Lincoln City Council elections by ward. Red shows Labour seats and blue shows Conservative seats. Map showing the results of the 2003 Lincoln City Council elections by ward. Red shows Labour seats and blue shows Conservative seats. | ||||||||||||||||||||||||||||
| ||||||||||||||||||||||||||||
Elections to City of Lincoln Council in Lincolnshire, England, were held on 1 May 2003. One third of the Council was up for election and the Labour Party stayed in overall control of the council.
A trial took place for all postal voting leading to turnout increasing from 26% in 2002 to 47% in this election.
After the election, the composition of the council was:
- Labour 27
- Conservative 6
Election result
| Party | Seats | Gains | Losses | Net gain/loss | Seats % | Votes % | Votes | +/− | |
|---|---|---|---|---|---|---|---|---|---|
| Labour | 11 | 0 | 0 | 100 | 51.5 | 14,382 | |||
| Conservative | 0 | 0 | 0 | 0 | 35.8 | 10,005 | |||
| Lincoln Independent Alliance | 0 | 0 | 0 | 0 | 5.2 | 1,455 | |||
| Liberal Democrats | 0 | 0 | 0 | 0 | 2.9 | 812 | |||
| Green | 0 | 0 | 0 | 0 | 2.4 | 657 | |||
| Independent | 0 | 0 | 0 | 0 | 2.2 | 613 | |||
Ward results
Abbey
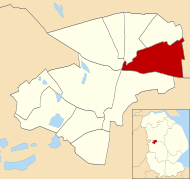
| Party | Candidate | Votes | % | |
|---|---|---|---|---|
| Labour | Kathleen Brothwell | 1,011 | 50.4 | |
| Conservative | David Bellamy | 641 | 32.0 | |
| Liberal Democrats | Charles Shaw | 353 | 17.6 | |
| Majority | 370 | 18.4 | ||
| Turnout | 2,005 | 46.2% | ||
| Labour hold | ||||
Birchwood

| Party | Candidate | Votes | % | |
|---|---|---|---|---|
| Labour | Stephen Allnutt | 1,100 | 45.2 | |
| Conservative | Frank Martin | 801 | 32.9 | |
| Lincoln Independent Alliance | Richard Hall | 532 | 21.9 | |
| Majority | 299 | 12.3 | ||
| Turnout | 2,433 | 46.3% | ||
| Labour hold | ||||
Boultham
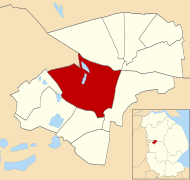
| Party | Candidate | Votes | % | |
|---|---|---|---|---|
| Labour | Richard Coupland | 1,346 | 53.6 | |
| Independent | Malcolm Skeels | 613 | 24.4 | |
| Conservative | John Woolf | 550 | 21.9 | |
| Majority | 733 | 29.2 | ||
| Turnout | 2,509 | 46.8% | ||
| Labour hold | ||||
Bracebridge

| Party | Candidate | Votes | % | |
|---|---|---|---|---|
| Labour | Bud Robinson | 1,628 | 52.5 | |
| Conservative | Paul Grice | 1,473 | 47.5 | |
| Majority | 155 | 5.0 | ||
| Turnout | 3,101 | 50.8% | ||
| Labour hold | ||||
Carholme

| Party | Candidate | Votes | % | |
|---|---|---|---|---|
| Labour | Karen Lee | 970 | 42.0 | |
| Conservative | Ann Duguid | 584 | 25.3 | |
| Liberal Democrats | Phillip Mappin | 459 | 19.9 | |
| Green | Nicola Watson | 299 | 12.9 | |
| Majority | 386 | 16.7 | ||
| Turnout | 2,312 | 45.5% | ||
| Labour hold | ||||
Castle

| Party | Candidate | Votes | % | |
|---|---|---|---|---|
| Labour | Anthony Morgan | 1,470 | 66.2 | |
| Conservative | Michael Reeve | 749 | 33.8 | |
| Majority | 721 | 32.4 | ||
| Turnout | 2,219 | 47.7% | ||
| Labour hold | ||||
Glebe
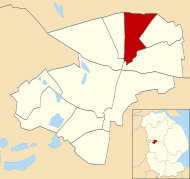
| Party | Candidate | Votes | % | |
|---|---|---|---|---|
| Labour | Richard Metcalfe | 1,254 | 44.0 | |
| Lincoln Independent Alliance | George Spencer | 923 | 32.4 | |
| Conservative | Marion Mellows | 670 | 23.5 | |
| Majority | 331 | 11.6 | ||
| Turnout | 2,847 | 48.8% | ||
| Labour hold | ||||
Hartsholme

| Party | Candidate | Votes | % | |
|---|---|---|---|---|
| Labour | Christopher Grimshaw | 1,563 | 51.4 | |
| Conservative | Philip Hubbard | 1,477 | 48.6 | |
| Majority | 86 | 2.8 | ||
| Turnout | 3,070 | 46.7% | ||
| Labour hold | ||||
Minster

| Party | Candidate | Votes | % | |
|---|---|---|---|---|
| Labour | Morris Cookson | 1,336 | 50.4 | |
| Conservative | Anthony Calvert | 1,313 | 49.6 | |
| Majority | 23 | 0.8 | ||
| Turnout | 2,649 | 51.6% | ||
| Labour hold | ||||
Moorland
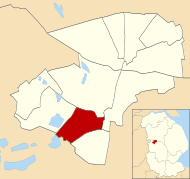
| Party | Candidate | Votes | % | |
|---|---|---|---|---|
| Labour | Geoffrey Ellis | 1,638 | 58.6 | |
| Conservative | Duncan Fraser | 1,157 | 41.4 | |
| Majority | 481 | 17.2 | ||
| Turnout | 2,795 | 51.0% | ||
| Labour hold | ||||
Park
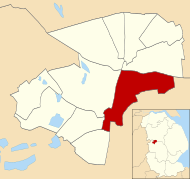
| Party | Candidate | Votes | % | |
|---|---|---|---|---|
| Labour | David Jackson | 1,066 | 52.9 | |
| Conservative | Barry Briggs | 590 | 29.3 | |
| Green | Kenneth Yates | 358 | 17.8 | |
| Majority | 576 | 23.6 | ||
| Turnout | 2,014 | 39.1% | ||
| Labour hold | ||||
References
- "Council compositions by year". The Elections Centre.
- "Local Election Summaries 2003". The Elections Centre.
- "Council by Council - Lincoln". BBC News. Retrieved 2 November 2019.
- "Postal voting is election's big winner". BBC Online. 2 May 2003. Retrieved 29 April 2008.
- ^ Andrew Teale. "Local Election Results 2003 - Lincoln". Local Elections Archive Project. Retrieved 5 November 2019.
| (2002 ←) | |
|---|---|
| Metropolitan boroughs |
|
| Unitary authorities |
|
| District councils (England) |
|
| Scottish councils |
|
| National Assembly and Parliament elections | |