| |||||||||||||||||||||||||||||||
| |||||||||||||||||||||||||||||||
 | |||||||||||||||||||||||||||||||
| Politics of Malta |
|---|
 |
| Republic |
| Government |
| Parliament |
| Judiciary |
|
Political parties |
| Recent elections |
Administrative divisions
|
|
Foreign relations
|
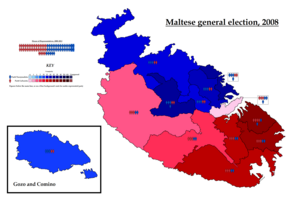
General elections were held in Malta on 8 March 2008 to elect all members of the House of Representatives They were held alongside local elections.
The elections were contested by the Nationalist Party, the Labour party, six other parties and independents. The governing Nationalist Party led by Lawrence Gonzi won its third consecutive election against the Labour Party led by Alfred Sant, winning the popular vote by a margin of just 0.55% and with its majority in parliament reduced to just one seat. Voter turnout was 93%.
Background
The House of Representatives was dissolved on 4 February, with elections scheduled for 8 March, the same day that local elections were to be held in 23 of 68 local councils.
Results
Initial exit polls and statistics suggested a very close result. Preliminary results had been expected by Sunday noon but these had to be delayed until a full first count was completed.
The Nationalist Party won with 49.33% to Labour's 48.9% a difference of 1,580 votes. Just under 2% of registered voters, 5,266 individuals, failed to collect their voting documents, so fewer than 310,000 people were eligible to vote on 8 March 2008. In total, voter turnout was 93%, the lowest in Malta since 1971.
As the Nationalist Party won the popular vote but elected only 31 Members of Parliament to Labour's 34, it was assigned an additional four seats to give the party a parliamentary majority.
Two other political parties participated in this election, Democratic Alternative and National Action, but both failed to win any seats.
Twelve casual elections were held in April 2008 to fill vacancies arising from candidates elected from two districts declining their second seat. Both the Nationalist Party and Labour each elected six members in this way, leaving the overall parliamentary numbers unchanged.
 | |||||
|---|---|---|---|---|---|
| Party | Votes | % | Seats | +/– | |
| Nationalist Party | 143,468 | 49.34 | 35 | 0 | |
| Malta Labour Party | 141,888 | 48.79 | 34 | +4 | |
| Democratic Alternative | 3,810 | 1.31 | 0 | 0 | |
| National Action | 1,461 | 0.50 | 0 | New | |
| Imperium Europa | 84 | 0.03 | 0 | New | |
| Gozitan Party | 37 | 0.01 | 0 | New | |
| Alpha Liberal Democrats | 21 | 0.01 | 0 | New | |
| Forward Malta | 8 | 0.00 | 0 | New | |
| Independents | 22 | 0.01 | 0 | 0 | |
| Total | 290,799 | 100.00 | 69 | +4 | |
| Valid votes | 290,799 | 98.84 | |||
| Invalid/blank votes | 3,415 | 1.16 | |||
| Total votes | 294,214 | 100.00 | |||
| Registered voters/turnout | 315,357 | 93.30 | |||
| Source: DOI, Nohlen & Stöver | |||||
See also
References
- Michael Carabott, "Election on 8 March: PM shows ‘the way forward’" The Malta Independent, 5 February 2008
- "Nationalist supporters celebrate a narrow victory", The Times of Malta, 9 March 2008.
- "The Waiting Game: what to look out for", "The Times of Malta", 9 March 2008.
- "Turnout drops to 93%, lowest since 1971", The Times of Malta, 9 March 2008.
- timesofmalta.com - UPDATED: Vote counting almost completed
- "Department of Information". Doi.gov.mt. 2008-04-17. Retrieved 2010-11-14.
- Dieter Nohlen & Philip Stöver (2010) Elections in Europe: A data handbook, p1309 ISBN 9783832956097
| General elections | |
|---|---|
| European elections | |
| Local elections | |
| Referendums | |
| See also: Presidential elections | |

