Main article: 2016 United States presidential election
| ||||||||||||||||||||||||||
| Turnout | 72.77% | |||||||||||||||||||||||||
|---|---|---|---|---|---|---|---|---|---|---|---|---|---|---|---|---|---|---|---|---|---|---|---|---|---|---|
| ||||||||||||||||||||||||||
 County results
 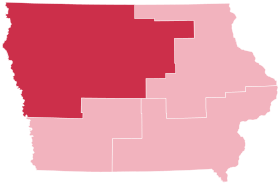 Congressional district results
 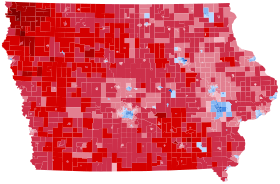 Precinct results
| ||||||||||||||||||||||||||
| ||||||||||||||||||||||||||

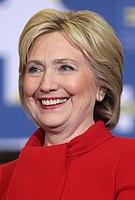
The 2016 United States presidential election in Iowa was held on Tuesday, November 8, 2016, as part of the 2016 United States presidential election in which all 50 states plus the District of Columbia participated. Iowa voters chose electors to represent them in the Electoral College via a popular vote, pitting the Republican Party's nominee, businessman Donald Trump, and his running mate Indiana Governor Mike Pence against the Democratic Party nominee, former Secretary of State Hillary Clinton, and her running mate Virginia Senator Tim Kaine. Iowa has six electoral votes in the Electoral College.
Trump won the state with 51.15% of the vote, while Clinton received 41.74% (a margin of 9.41%). Clinton's performance in Iowa was the worst performance for a Democratic presidential candidate since 1980. Trump, besides being the first Republican to carry the state since George W. Bush in 2004, won over a dozen counties that had not voted Republican since Ronald Reagan was on the ticket; won two counties that had last voted Republican in Richard Nixon's landslide victory in 1972; and also won Dubuque County, which had last voted Republican in 1956. Trump carried Iowa by the largest margin of any Republican candidate since Reagan in 1980, and he was the first Republican to win an outright majority of the state's vote since Reagan's historic 1984 landslide. Trump enjoyed the support of working-class whites in the agricultural industry, as well as the endorsement of Iowa's GOP establishment.
Caucuses
Further information: United States presidential electionThe incumbent President of the United States, Barack Obama, a Democrat and former U.S. Senator from Illinois, was first elected to the presidency in 2008, running with U.S. Senator Joe Biden of Delaware. Defeating the Republican nominee, Senator John McCain of Arizona, with 52.9% of the popular vote and 68% of the electoral vote, Obama succeeded two-term Republican President George W. Bush, the former Governor of Texas. Obama and Biden were reelected in the 2012 presidential election, defeating former Massachusetts Governor Mitt Romney with 51.1% of the popular vote and 61.7% of electoral votes. Although Barack Obama's approval rating in the RealClearPolitics poll tracking average remained between 40 and 50 percent for most of his second term, it experienced a surge in early 2016 and reached its highest point since 2012 during June of that year. Analyst Nate Cohn noted that a strong approval rating for President Obama would equate to a strong performance for the Democratic candidate, and vice versa.
President Obama was not eligible to be re-elected after having served two terms. Obama's running-mate and two-term Vice President Biden decided not to enter the race for the Democratic presidential nomination either.
Democratic caucuses
Main article: 2016 Iowa Democratic presidential caucusesProcedure
Further information: Walking subcaucusThere is no ballot; instead, a unique form of debate and groupings chose delegates to county conventions supporting Hillary Clinton, Martin O'Malley, and Bernie Sanders. The Iowa Democratic Party does not release vote counts or the numbers of these delegates.

| Candidate | State delegate equivalents | Estimated delegates | |||
|---|---|---|---|---|---|
| Count | Percentage | Pledged | Unpledged | Total | |
| 700.47 | 49.84% | 23 | 6 | 29 | |
| Bernie Sanders | 696.92 | 49.59% | 21 | 0 | 21 |
| Martin O'Malley | 7.63 | 0.54% | 0 | 0 | 0 |
| Uncommitted | 0.46 | 0.03% | 0 | 1 | 1 |
| Total | 1,405.48 | 100% | 44 | 7 | 51 |
| Source: | |||||
County Conventions
In early March, the delegates chosen in the Caucuses met chose delegates to the Congressional District Conventions.
Republican caucuses
Main article: 2016 Iowa Republican presidential caucuses| This section should include a summary of 2016 Iowa Republican presidential caucuses. See Misplaced Pages:Summary style for information on how to incorporate it into this article's main text. (July 2016) |
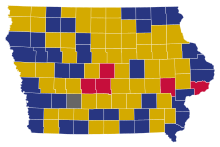
| Candidate | Votes | Percentage | Actual delegate count | ||
|---|---|---|---|---|---|
| Bound | Unbound | Total | |||
| Ted Cruz | 51,666 | 27.64% | 8 | 0 | 8 |
| Donald Trump | 45,427 | 24.3% | 7 | 0 | 7 |
| Marco Rubio | 43,165 | 23.12% | 7 | 0 | 7 |
| Ben Carson | 17,395 | 9.3% | 3 | 0 | 3 |
| Rand Paul | 8,481 | 4.54% | 1 | 0 | 1 |
| Jeb Bush | 5,238 | 2.8% | 1 | 0 | 1 |
| Carly Fiorina | 3,485 | 1.86% | 1 | 0 | 1 |
| John Kasich | 3,474 | 1.86% | 1 | 0 | 1 |
| Mike Huckabee | 3,345 | 1.79% | 1 | 0 | 1 |
| Chris Christie | 3,284 | 1.76% | 0 | 0 | 0 |
| Rick Santorum | 1,783 | 0.95% | 0 | 0 | 0 |
| Other | 117 | 0.06% | 0 | 0 | 0 |
| Jim Gilmore | 12 | 0.01% | 0 | 0 | 0 |
| Unprojected delegates: | 0 | 0 | 0 | ||
| Total: | 186,932 | 100.00% | 30 | 0 | 30 |
| Source: "Iowa". cnn.com. Retrieved November 23, 2016. | |||||
General election
Polling
See also: Statewide opinion polling for the 2016 United States presidential election § IowaUp until late August 2016, the election was close, with both Donald Trump and Hillary Clinton winning polls but neither taking a serious lead. In September 2016, Trump gained momentum, by winning a poll 44% to 39% in early September and then winning 3 more polls in a row by margins larger than 5%. From late September 2016 until election day, Trump won every poll but one. The final poll average showed Donald Trump ahead 44% to 41%, with many undecided voters that mostly swung to Donald Trump on election night. The latest poll also showed Trump ahead by 46% to 39%.
Predictions
| Source | Ranking | As of |
|---|---|---|
| CNN | Lean R (flip) | November 4, 2016 |
| Cook Political Report | Lean R (flip) | November 7, 2016 |
| Electoral-vote.com | Likely R (flip) | November 8, 2016 |
| NBC | Lean R (flip) | November 7, 2016 |
| RealClearPolitics | Tossup | November 7, 2016 |
| Rothenberg Political Report | Tilt R (flip) | November 7, 2016 |
| Sabato's Crystal Ball | Lean R (flip) | November 7, 2016 |
Results
Chart of popular vote
Trump (51.15%) Clinton (41.74%) Johnson (3.78%) Write-ins (1.13%) McMullin (0.79%) Stein (0.73%) Others (0.67%)| 2016 United States presidential election in Iowa | ||||||
|---|---|---|---|---|---|---|
| Party | Candidate | Running mate | Votes | Percentage | Electoral votes | |
| Republican | Donald Trump | Mike Pence | 800,983 | 51.15% | 6 | |
| Democratic | Hillary Clinton | Tim Kaine | 653,669 | 41.74% | 0 | |
| Libertarian | Gary Johnson | Bill Weld | 59,186 | 3.78% | 0 | |
| Write-in | Various | Various | 17,746 | 1.13% | 0 | |
| Independent | Evan McMullin | Nathan Johnson | 12,366 | 0.79% | 0 | |
| Green | Jill Stein | Ajamu Baraka | 11,479 | 0.73% | 0 | |
| Constitution | Darrell L. Castle | Scott N. Bradley | 5,335 | 0.34% | 0 | |
| New Independent | Lynn Kahn | Jay Stolba | 2,247 | 0.14% | 0 | |
| Legal Marijuana Now | Dan Vacek | Mark Elworth | 2,246 | 0.14% | 0 | |
| Independent | Rocky De La Fuente | Michael Steinberg | 451 | 0.03% | 0 | |
| Socialism and Liberation | Gloria La Riva | Dennis J. Banks | 323 | 0.02% | 0 | |
| Totals | 1,566,031 | 100.00% | 6 | |||
| Voter turnout (Voting age population) | 72.0% | |||||
| Source: Iowa Secretary of State | ||||||
By county
| County | Donald Trump Republican |
Hillary Clinton Democratic |
Various candidates Other parties |
Margin | Total | ||||
|---|---|---|---|---|---|---|---|---|---|
| # | % | # | % | # | % | # | % | ||
| Adair | 2,461 | 64.58% | 1,133 | 29.73% | 217 | 5.69% | 1,328 | 34.85% | 3,811 |
| Adams | 1,395 | 66.24% | 565 | 26.83% | 146 | 6.93% | 830 | 39.41% | 2,106 |
| Allamakee | 4,093 | 59.12% | 2,421 | 34.97% | 409 | 5.91% | 1,672 | 24.15% | 6,923 |
| Appanoose | 4,033 | 65.73% | 1,814 | 29.56% | 289 | 4.71% | 2,219 | 36.17% | 6,136 |
| Audubon | 2,136 | 62.60% | 1,080 | 31.65% | 196 | 5.75% | 1,056 | 30.95% | 3,412 |
| Benton | 8,232 | 59.46% | 4,678 | 33.79% | 934 | 6.75% | 3,554 | 25.67% | 13,844 |
| Black Hawk | 27,476 | 42.66% | 32,233 | 50.05% | 4,696 | 7.29% | -4,757 | -7.39% | 64,405 |
| Boone | 7,484 | 52.72% | 5,541 | 39.03% | 1,171 | 8.25% | 1,943 | 13.69% | 14,196 |
| Bremer | 7,208 | 53.24% | 5,356 | 39.56% | 974 | 7.20% | 1,852 | 13.68% | 13,538 |
| Buchanan | 5,510 | 53.75% | 3,970 | 38.72% | 772 | 7.53% | 1,540 | 15.03% | 10,252 |
| Buena Vista | 4,903 | 59.23% | 2,856 | 34.50% | 519 | 6.27% | 2,047 | 24.73% | 8,278 |
| Butler | 4,921 | 65.50% | 2,157 | 28.71% | 435 | 5.79% | 2,764 | 36.79% | 7,513 |
| Calhoun | 3,468 | 67.22% | 1,398 | 27.10% | 293 | 5.68% | 2,070 | 40.12% | 5,159 |
| Carroll | 6,638 | 62.96% | 3,309 | 31.38% | 597 | 5.66% | 3,329 | 31.58% | 10,544 |
| Cass | 4,761 | 66.82% | 1,951 | 27.38% | 413 | 5.80% | 2,810 | 39.44% | 7,125 |
| Cedar | 5,295 | 55.50% | 3,599 | 37.72% | 647 | 6.78% | 1,696 | 17.78% | 9,541 |
| Cerro Gordo | 11,621 | 50.60% | 9,862 | 42.94% | 1,482 | 6.46% | 1,759 | 7.66% | 22,965 |
| Cherokee | 4,192 | 66.99% | 1,679 | 26.83% | 387 | 6.18% | 2,513 | 40.16% | 6,258 |
| Chickasaw | 3,742 | 58.15% | 2,266 | 35.21% | 427 | 6.64% | 1,476 | 22.94% | 6,435 |
| Clarke | 2,713 | 60.91% | 1,465 | 32.89% | 276 | 6.20% | 1,248 | 28.02% | 4,454 |
| Clay | 5,877 | 68.20% | 2,249 | 26.10% | 491 | 5.70% | 3,628 | 42.10% | 8,617 |
| Clayton | 5,317 | 58.24% | 3,237 | 35.46% | 575 | 6.30% | 2,080 | 22.78% | 9,129 |
| Clinton | 11,276 | 48.88% | 10,095 | 43.76% | 1,696 | 7.36% | 1,181 | 5.12% | 23,067 |
| Crawford | 4,617 | 66.58% | 1,991 | 28.71% | 327 | 4.71% | 2,626 | 37.87% | 6,935 |
| Dallas | 19,339 | 50.56% | 15,701 | 41.05% | 3,212 | 8.39% | 3,638 | 9.51% | 38,252 |
| Davis | 2,723 | 70.14% | 977 | 25.17% | 182 | 4.69% | 1,746 | 44.97% | 3,882 |
| Decatur | 2,296 | 61.49% | 1,201 | 32.16% | 237 | 6.35% | 1,095 | 29.33% | 3,734 |
| Delaware | 5,694 | 61.62% | 2,957 | 32.00% | 590 | 6.38% | 2,737 | 29.62% | 9,241 |
| Des Moines | 9,529 | 49.88% | 8,212 | 42.99% | 1,362 | 7.13% | 1,317 | 6.89% | 19,103 |
| Dickinson | 6,753 | 65.22% | 3,056 | 29.52% | 545 | 5.26% | 3,697 | 35.70% | 10,354 |
| Dubuque | 23,460 | 47.18% | 22,850 | 45.96% | 3,411 | 6.86% | 610 | 1.22% | 49,721 |
| Emmet | 3,124 | 65.73% | 1,357 | 28.55% | 272 | 5.72% | 1,767 | 37.18% | 4,753 |
| Fayette | 5,620 | 56.34% | 3,689 | 36.98% | 666 | 6.68% | 1,931 | 19.36% | 9,975 |
| Floyd | 4,375 | 54.28% | 3,179 | 39.44% | 506 | 6.28% | 1,196 | 14.84% | 8,060 |
| Franklin | 3,163 | 63.67% | 1,493 | 30.05% | 312 | 6.28% | 1,670 | 33.62% | 4,968 |
| Fremont | 2,407 | 66.95% | 963 | 26.79% | 225 | 6.26% | 1,444 | 40.16% | 3,595 |
| Greene | 2,820 | 58.49% | 1,691 | 35.08% | 310 | 6.43% | 1,129 | 23.41% | 4,821 |
| Grundy | 4,527 | 65.88% | 1,856 | 27.01% | 489 | 7.11% | 2,671 | 38.87% | 6,872 |
| Guthrie | 3,628 | 63.10% | 1,732 | 30.12% | 390 | 6.78% | 1,896 | 32.98% | 5,750 |
| Hamilton | 4,463 | 58.01% | 2,726 | 35.43% | 505 | 6.56% | 1,737 | 22.58% | 7,694 |
| Hancock | 3,977 | 67.74% | 1,587 | 27.03% | 307 | 5.23% | 2,390 | 40.71% | 5,871 |
| Hardin | 5,254 | 61.57% | 2,787 | 32.66% | 492 | 5.77% | 2,467 | 28.91% | 8,533 |
| Harrison | 4,902 | 65.67% | 2,131 | 28.55% | 432 | 5.78% | 2,771 | 37.12% | 7,465 |
| Henry | 5,779 | 61.45% | 2,904 | 30.88% | 721 | 7.67% | 2,875 | 30.57% | 9,404 |
| Howard | 2,611 | 57.27% | 1,677 | 36.78% | 271 | 5.95% | 934 | 20.49% | 4,559 |
| Humboldt | 3,568 | 70.14% | 1,252 | 24.61% | 267 | 5.25% | 2,316 | 45.53% | 5,087 |
| Ida | 2,655 | 73.50% | 792 | 21.93% | 165 | 4.57% | 1,863 | 51.57% | 3,612 |
| Iowa | 5,205 | 58.46% | 3,084 | 34.64% | 615 | 6.90% | 2,121 | 23.82% | 8,904 |
| Jackson | 5,824 | 56.49% | 3,837 | 37.22% | 649 | 6.29% | 1,987 | 19.27% | 10,310 |
| Jasper | 10,560 | 55.48% | 7,109 | 37.35% | 1,365 | 7.17% | 3,451 | 18.13% | 19,034 |
| Jefferson | 3,748 | 45.95% | 3,710 | 45.49% | 698 | 8.56% | 38 | 0.46% | 8,156 |
| Johnson | 21,044 | 27.35% | 50,200 | 65.25% | 5,696 | 7.40% | -29,156 | -37.90% | 76,940 |
| Jones | 5,720 | 56.45% | 3,787 | 37.37% | 626 | 6.18% | 1,933 | 19.08% | 10,133 |
| Keokuk | 3,390 | 68.00% | 1,342 | 26.92% | 253 | 5.08% | 2,048 | 41.08% | 4,985 |
| Kossuth | 5,653 | 65.68% | 2,543 | 29.55% | 411 | 4.77% | 3,110 | 36.13% | 8,607 |
| Lee | 8,803 | 54.50% | 6,215 | 38.48% | 1,133 | 7.02% | 2,588 | 16.02% | 16,151 |
| Linn | 48,390 | 41.32% | 58,935 | 50.33% | 9,773 | 8.35% | -10,545 | -9.01% | 117,098 |
| Louisa | 3,069 | 61.28% | 1,648 | 32.91% | 291 | 5.81% | 1,421 | 28.37% | 5,008 |
| Lucas | 2,877 | 66.08% | 1,239 | 28.46% | 238 | 5.46% | 1,638 | 37.62% | 4,354 |
| Lyon | 5,192 | 81.42% | 920 | 14.43% | 265 | 4.15% | 4,272 | 66.99% | 6,377 |
| Madison | 5,360 | 62.07% | 2,678 | 31.01% | 598 | 6.92% | 2,682 | 31.06% | 8,636 |
| Mahaska | 7,432 | 69.90% | 2,619 | 24.63% | 581 | 5.47% | 4,813 | 45.27% | 10,632 |
| Marion | 10,962 | 61.53% | 5,482 | 30.77% | 1,372 | 7.70% | 5,480 | 30.76% | 17,816 |
| Marshall | 9,146 | 50.87% | 7,652 | 42.56% | 1,182 | 6.57% | 1,494 | 8.31% | 17,980 |
| Mills | 5,067 | 65.82% | 2,090 | 27.15% | 541 | 7.03% | 2,977 | 38.67% | 7,698 |
| Mitchell | 3,190 | 58.89% | 1,888 | 34.85% | 339 | 6.26% | 1,302 | 24.04% | 5,417 |
| Monona | 3,120 | 68.24% | 1,247 | 27.27% | 205 | 4.49% | 1,873 | 40.97% | 4,572 |
| Monroe | 2,638 | 68.25% | 1,056 | 27.32% | 171 | 4.43% | 1,582 | 40.93% | 3,865 |
| Montgomery | 3,436 | 68.12% | 1,314 | 26.05% | 294 | 5.83% | 2,122 | 42.07% | 5,044 |
| Muscatine | 9,584 | 49.32% | 8,368 | 43.06% | 1,482 | 7.62% | 1,216 | 6.26% | 19,434 |
| O'Brien | 5,752 | 77.67% | 1,315 | 17.76% | 339 | 4.57% | 4,437 | 59.91% | 7,406 |
| Osceola | 2,531 | 78.77% | 552 | 17.18% | 130 | 4.05% | 1,979 | 61.59% | 3,213 |
| Page | 4,893 | 69.46% | 1,807 | 25.65% | 344 | 4.89% | 3,086 | 43.81% | 7,044 |
| Palo Alto | 3,081 | 65.51% | 1,398 | 29.73% | 224 | 4.76% | 1,683 | 35.78% | 4,703 |
| Plymouth | 9,680 | 73.39% | 2,885 | 21.87% | 625 | 4.74% | 6,795 | 51.52% | 13,190 |
| Pocahontas | 2,702 | 69.91% | 963 | 24.92% | 200 | 5.17% | 1,739 | 44.99% | 3,865 |
| Polk | 93,492 | 40.38% | 119,804 | 51.74% | 18,259 | 7.88% | -26,312 | -11.36% | 231,555 |
| Pottawattamie | 24,447 | 57.28% | 15,355 | 35.98% | 2,878 | 6.74% | 9,092 | 21.30% | 42,680 |
| Poweshiek | 4,946 | 50.30% | 4,304 | 43.77% | 583 | 5.93% | 642 | 6.53% | 9,833 |
| Ringgold | 1,824 | 67.38% | 753 | 27.82% | 130 | 4.80% | 1,071 | 39.56% | 2,707 |
| Sac | 3,703 | 71.05% | 1,270 | 24.37% | 239 | 4.58% | 2,433 | 46.68% | 5,212 |
| Scott | 39,149 | 45.41% | 40,440 | 46.90% | 6,631 | 7.69% | -1,291 | -1.49% | 86,220 |
| Shelby | 4,362 | 68.48% | 1,662 | 26.09% | 346 | 5.43% | 2,700 | 42.39% | 6,370 |
| Sioux | 14,785 | 81.26% | 2,300 | 12.64% | 1,109 | 6.10% | 12,485 | 68.62% | 18,194 |
| Story | 19,458 | 38.40% | 25,709 | 50.74% | 5,500 | 10.86% | -6,251 | -12.34% | 50,667 |
| Tama | 4,971 | 56.80% | 3,196 | 36.52% | 585 | 6.68% | 1,775 | 20.28% | 8,752 |
| Taylor | 2,111 | 69.69% | 758 | 25.02% | 160 | 5.29% | 1,353 | 44.67% | 3,029 |
| Union | 3,525 | 60.44% | 1,922 | 32.96% | 385 | 6.60% | 1,603 | 27.48% | 5,832 |
| Van Buren | 2,527 | 70.96% | 845 | 23.73% | 189 | 5.31% | 1,682 | 47.23% | 3,561 |
| Wapello | 8,715 | 57.53% | 5,594 | 36.93% | 840 | 5.54% | 3,121 | 20.60% | 15,149 |
| Warren | 14,814 | 54.26% | 10,411 | 38.14% | 2,075 | 7.60% | 4,403 | 16.12% | 27,300 |
| Washington | 6,173 | 56.48% | 3,943 | 36.08% | 813 | 7.44% | 2,230 | 20.40% | 10,929 |
| Wayne | 2,069 | 70.37% | 719 | 24.46% | 152 | 5.17% | 1,350 | 45.91% | 2,940 |
| Webster | 10,056 | 57.69% | 6,305 | 36.17% | 1,069 | 6.14% | 3,751 | 21.52% | 17,430 |
| Winnebago | 3,447 | 59.56% | 1,931 | 33.37% | 409 | 7.07% | 1,516 | 26.19% | 5,787 |
| Winneshiek | 5,344 | 47.03% | 5,254 | 46.24% | 764 | 6.73% | 90 | 0.79% | 11,362 |
| Woodbury | 24,727 | 56.56% | 16,210 | 37.08% | 2,781 | 6.36% | 8,517 | 19.48% | 43,718 |
| Worth | 2,453 | 57.62% | 1,530 | 35.94% | 274 | 6.44% | 923 | 21.68% | 4,257 |
| Wright | 3,800 | 63.06% | 1,896 | 31.46% | 330 | 5.48% | 1,904 | 31.60% | 6,026 |
| Totals | 800,983 | 51.15% | 653,669 | 41.74% | 111,379 | 7.11% | 147,314 | 9.41% | 1,566,031 |
 Swing by county
Legend
- Democratic — +>15%
- Democratic — +12.5-15%
- Democratic — +10-12.5%
- Democratic — +5-7.5%
- Democratic — +2.5-5%
- Democratic — +0-2.5%
- Republican — +0-2.5%
- Republican — +2.5-5%
- Republican — +5-7.5%
- Republican — +7.5-10%
- Republican — +10-12.5%
- Republican — +12.5-15%
- Republican — +>15%
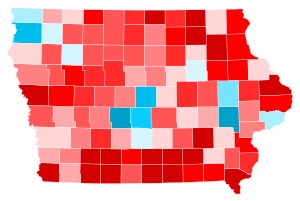 Trend relative to the state by county
Legend
- Democratic — +>15%
- Democratic — +12.5-15%
- Democratic — +10-12.5%
- Democratic — +5-7.5%
- Democratic — +2.5-5%
- Democratic — +0-2.5%
- Republican — +0-2.5%
- Republican — +2.5-5%
- Republican — +5-7.5%
- Republican — +7.5-10%
- Republican — +10-12.5%
- Republican — +12.5-15%
- Republican — +>15%
 County flips
Legend
-
Democratic
HoldRepublican
Hold Gain from Democratic
Counties that flipped from Democratic to Republican
- Allamakee (largest city: Waukon)
- Boone (largest city: Boone)
- Bremer (largest city: Waverly)
- Buchanan (largest city: Independence)
- Cedar (largest city: Tipton)
- Cerro Gordo (largest city: Mason City)
- Chickasaw (largest city: New Hampton)
- Clarke (largest city: Osceola)
- Clayton (largest city: Guttenberg)
- Clinton (largest city: Clinton)
- Des Moines (largest city: Burlington)
- Dubuque (largest city: Dubuque)
- Fayette (largest city: Oelwein)
- Floyd (largest city: Charles City)
- Howard (largest city: Cresco)
- Jackson (largest city: Maquoketa)
- Jasper (largest city: Newton)
- Jefferson (largest city: Fairfield)
- Jones (largest city: Anamosa)
- Lee (largest city: Fort Madison)
- Louisa (largest city: Wapello)
- Marshall (largest city: Marshalltown)
- Mitchell (largest city: Osage)
- Muscatine (largest city: Muscatine)
- Poweshiek (largest city: Grinnell)
- Tama (largest city: Tama)
- Union (largest city: Creston)
- Wapello (largest city: Ottumwa)
- Webster (largest city: Fort Dodge)
- Winneshiek (largest city: Decorah)
- Woodbury (largest city: Sioux City)
- Worth (largest city: Northwood)
By congressional district
Trump won all 4 of the congressional districts, including one held by a Democrat.
| District | Trump | Clinton | Representative |
|---|---|---|---|
| 1st | 48% | 45% | Rod Blum |
| 2nd | 49% | 44% | Dave Loebsack |
| 3rd | 48% | 45% | David Young |
| 4th | 60% | 33% | Steve King |
Analysis
The difference of 9.4% points was the largest winning margin for Trump in a state that had voted for Barack Obama in 2012. This was also the first time since 1976 that Iowa voted to the right of Texas, which Trump won in this election by 8.99 points. Trump carried 93 out of 99 counties, the most for a Republican presidential nominee in the state since 1980, and he flipped 32 counties won by Obama in 2012, the most out of any state. This was the first time since 1988 in which Iowa did not go for the winner of the popular vote. It was also the first time since 2004 (and only the second since 1984) that Iowa would vote for a Republican candidate. This is also the first election since 1980 in which a non-incumbent Republican won the state.
See also
- United States presidential elections in Iowa
- 2016 Democratic Party presidential debates and forums
- 2016 Democratic Party presidential primaries
- 2016 Republican Party presidential debates and forums
- 2016 Republican Party presidential primaries
- United States presidential election
References
- "Distribution of Electoral Votes". National Archives and Records Administration. September 19, 2019. Retrieved November 25, 2020.
- "Iowa Election Results 2016 – The New York Times". Retrieved November 10, 2016.
- "Donald Trump wins Iowa on a wave of popular discontent". Des Moines Register. Retrieved January 16, 2017.
- Bash, Dana; Crutchfield, Abigail (November 2, 2016). "Can Trump turn Iowa red?". CNN. Retrieved January 16, 2017.
- "United States House of Representatives floor summary for Jan 8, 2009". Clerk.house.gov. Archived from the original on April 2, 2012. Retrieved January 30, 2009.
- "Federal elections 2008" (PDF). Federal Election Commission. Retrieved May 11, 2015.
- "President Map". The New York Times. November 29, 2012. Retrieved May 11, 2015.
- "Election Other – President Obama Job Approval". RealClearPolitics. Retrieved December 24, 2015.
- Byrnes, Jesse (June 15, 2016). "Poll: Obama approval rating highest since 2012". The Hill. Retrieved June 19, 2016.
- Cohn, Nate (January 19, 2015). "What a Rise in Obama's Approval Rating Means for 2016". The New York Times. ISSN 0362-4331. Retrieved June 19, 2016.
- "Joe Biden Decides Not to Enter Presidential Race". The Wall Street Journal. Retrieved October 21, 2015.
- The Green Papers
- Iowa Democrats
- "RealClearPolitics - Election 2016 - Iowa: Trump vs. Clinton".
- "RealClearPolitics - Election 2016 - Iowa: Trump vs. Clinton".
- Chalian, David (November 4, 2016). "Road to 270: CNN's new election map". CNN. Retrieved February 10, 2019.
- "2016 Electoral Scorecard". The Cook Political Report. November 7, 2016. Archived from the original on February 7, 2019. Retrieved February 10, 2019.
- "2016 Predicted Electoral Map". Electoral-vote.com. Retrieved February 10, 2019.
- Todd, Chuck (November 7, 2016). "NBC's final battleground map shows a lead for Clinton". NBC News. Retrieved February 10, 2019.
- "2016 Election Maps - Battle for White House". RealClearPolitics. Retrieved February 10, 2019.
- "Presidential Ratings". The Rothenberg Political Report. Retrieved August 16, 2021.
- Sabato, Larry (November 7, 2016). "The Crystal Ball's 2016 Electoral College ratings". University of Virginia Center for Politics. Retrieved February 10, 2019.
- ^ Bentley, Chris (October 22, 2019). "Dozens Of Iowa Counties Flipped Red For Trump in 2016. Will They Stand By Him In 2020?". WBUR. Archived from the original on October 22, 2019. Retrieved September 1, 2020.
- "Presidential Results by Congressional District, 2000-2008 – Swing State Project".
External links
- RNC 2016 Republican Nominating Process Archived November 8, 2016, at the Wayback Machine
- Green papers for 2016 primaries, caucuses, and conventions
| (2015 ←) 2016 United States elections (→ 2017) | |
|---|---|
| U.S. President |
|
| U.S. Senate |
|
| U.S. House (Election ratings) |
|
| Governors | |
| Attorneys general | |
| State legislatures |
|
| Mayors |
|
| Local | |
| Statewide |
|
| State and district results of the 2016 United States presidential election | ||
|---|---|---|
|  | |
| (← 2012) 2016 United States presidential election (2020 →) | |||||||||||||||||||||||||||||||||||||||||||||||||||||||||||||||||
|---|---|---|---|---|---|---|---|---|---|---|---|---|---|---|---|---|---|---|---|---|---|---|---|---|---|---|---|---|---|---|---|---|---|---|---|---|---|---|---|---|---|---|---|---|---|---|---|---|---|---|---|---|---|---|---|---|---|---|---|---|---|---|---|---|---|
| Donald Trump, Mike Pence (R), 304 electoral votes; Hillary Clinton, Tim Kaine (D), 227 electoral votes | |||||||||||||||||||||||||||||||||||||||||||||||||||||||||||||||||
| |||||||||||||||||||||||||||||||||||||||||||||||||||||||||||||||||
| United States presidential primaries and caucuses | |||||||||||||||||||
|---|---|---|---|---|---|---|---|---|---|---|---|---|---|---|---|---|---|---|---|
| Election timelines | |||||||||||||||||||
| National opinion polling | |||||||||||||||||||
| State opinion polling | |||||||||||||||||||
| Fundraising | |||||||||||||||||||
| Debates and forums | |||||||||||||||||||
| Straw polls | |||||||||||||||||||
| Major events | |||||||||||||||||||
| Caucuses and primaries |
| ||||||||||||||||||
| Results breakdown | |||||||||||||||||||
| National conventions |
| ||||||||||||||||||
| Reforms | |||||||||||||||||||

