| |||||||||||||||||||||||||||||||||||||||||||||||||||||||||||||||||||||||||
| Chamber of Representatives | |||||||||||||||||||||||||||||||||||||||||||||||||||||||||||||||||||||||||
All 150 seats in the Chamber of Representatives 76 seats needed for a majority | |||||||||||||||||||||||||||||||||||||||||||||||||||||||||||||||||||||||||
| Turnout | 91.15% | ||||||||||||||||||||||||||||||||||||||||||||||||||||||||||||||||||||||||
|---|---|---|---|---|---|---|---|---|---|---|---|---|---|---|---|---|---|---|---|---|---|---|---|---|---|---|---|---|---|---|---|---|---|---|---|---|---|---|---|---|---|---|---|---|---|---|---|---|---|---|---|---|---|---|---|---|---|---|---|---|---|---|---|---|---|---|---|---|---|---|---|---|---|
| |||||||||||||||||||||||||||||||||||||||||||||||||||||||||||||||||||||||||
| Senate | |||||||||||||||||||||||||||||||||||||||||||||||||||||||||||||||||||||||||
40 of the 71 seats in the Senate 36 seats needed for a majority | |||||||||||||||||||||||||||||||||||||||||||||||||||||||||||||||||||||||||
| Turnout | 91.15% | ||||||||||||||||||||||||||||||||||||||||||||||||||||||||||||||||||||||||
| |||||||||||||||||||||||||||||||||||||||||||||||||||||||||||||||||||||||||
| Politics of Belgium |
|---|
 |
| Constitution |
| Monarchy |
| Federal Parliament |
| Federal Cabinet |
Judiciary
|
| Recent elections |
| Subdivisions |
Foreign relations
|
|
|
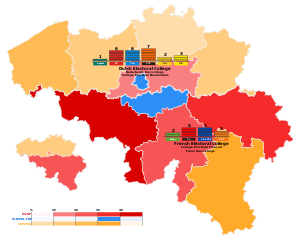
Federal elections were held in Belgium on 21 May 1995 to elect members of the Chamber of Representatives and Senate. The Christian People's Party (CVP) kept its position as largest party in Flanders and overall in Belgium, and Jean-Luc Dehaene (CVP) continued as Prime Minister.
On the same day, regional elections were also held. These were the first elections after the new 1993 Belgian Constitution, which turned Belgium formally into a federal state. The new Constitution also reduced the number of seats in the Chamber (from 212 to 150) and in the Senate (from 70 to 40 directly elected senators).
Results
Chamber of Representatives
 | |||||
|---|---|---|---|---|---|
| Party | Votes | % | Seats | +/– | |
| Christian People's Party | 1,042,933 | 17.18 | 29 | –10 | |
| Flemish Liberals and Democrats | 798,363 | 13.15 | 21 | –5 | |
| Socialistische Partij | 762,444 | 12.56 | 20 | –8 | |
| Parti Socialiste | 720,819 | 11.87 | 21 | –14 | |
| Liberal Reformist Party–Democratic Front of Francophones | 623,250 | 10.26 | 18 | –5 | |
| Vlaams Blok | 475,677 | 7.83 | 11 | –1 | |
| Christian Social Party | 469,101 | 7.73 | 12 | –6 | |
| People's Union | 283,516 | 4.67 | 5 | –5 | |
| Agalev | 269,058 | 4.43 | 5 | –2 | |
| Ecolo | 243,362 | 4.01 | 6 | –4 | |
| National Front | 138,496 | 2.28 | 2 | +1 | |
| BANAAN | 40,098 | 0.66 | 0 | New | |
| Aging with Dignity (Wallonia) | 26,227 | 0.43 | 0 | New | |
| Aging with Dignity (Flanders) | 25,195 | 0.41 | 0 | New | |
| Workers' Party of Belgium (Flanders) | 20,997 | 0.35 | 0 | 0 | |
| Agir | 15,374 | 0.25 | 0 | 0 | |
| Unitarist and Centrist | 13,878 | 0.23 | 0 | New | |
| Workers' Party of Belgium (Wallonia) | 13,250 | 0.22 | 0 | 0 | |
| Belgium–Europe–Belgium | 10,186 | 0.17 | 0 | 0 | |
| Flemish People's Party | 8,480 | 0.14 | 0 | New | |
| WALLON | 6,462 | 0.11 | 0 | New | |
| Communist Party | 6,277 | 0.10 | 0 | 0 | |
| Natural Law Party | 5,314 | 0.09 | 0 | New | |
| Youth | 5,243 | 0.09 | 0 | New | |
| Party of German-speaking Belgians | 4,426 | 0.07 | 0 | New | |
| EMPLOI | 3,812 | 0.06 | 0 | New | |
| PSP | 2,939 | 0.05 | 0 | New | |
| Employment is Investing in the Future | 2,936 | 0.05 | 0 | New | |
| Workers' Party of Belgium | 2,852 | 0.05 | 0 | 0 | |
| Parti Communautaire National-Européen | 2,554 | 0.04 | 0 | 0 | |
| Solidarity, Universality, Human Rights–BEB | 2,412 | 0.04 | 0 | 0 | |
| White | 2,410 | 0.04 | 0 | New | |
| Rally for the Freedom of the Belgians | 1,892 | 0.03 | 0 | New | |
| PLUS | 1,705 | 0.03 | 0 | New | |
| Renovators | 1,606 | 0.03 | 0 | New | |
| General Union of Total Independents | 1,603 | 0.03 | 0 | New | |
| PLN | 1,478 | 0.02 | 0 | New | |
| D | 1,471 | 0.02 | 0 | New | |
| General Association of the Elderly | 1,274 | 0.02 | 0 | New | |
| List for Europe, Workers and Democracy | 1,270 | 0.02 | 0 | New | |
| Democratic Union of the Francophones | 1,179 | 0.02 | 0 | New | |
| Union and Democratic Renewal | 1,009 | 0.02 | 0 | New | |
| UL | 907 | 0.01 | 0 | New | |
| Radical Alliance | 882 | 0.01 | 0 | New | |
| ADM | 831 | 0.01 | 0 | New | |
| LIGUE | 808 | 0.01 | 0 | New | |
| Front regional wallon | 750 | 0.01 | 0 | New | |
| Volksnationalitische Partij | 670 | 0.01 | 0 | New | |
| RVM | 566 | 0.01 | 0 | New | |
| DSA | 536 | 0.01 | 0 | New | |
| United Feminist Party | 533 | 0.01 | 0 | New | |
| ADD | 506 | 0.01 | 0 | New | |
| DLL | 450 | 0.01 | 0 | New | |
| Parti Communautaire National-Européen | 441 | 0.01 | 0 | 0 | |
| BEBEL | 393 | 0.01 | 0 | New | |
| Protection of the Animals | 329 | 0.01 | 0 | New | |
| National Interest | 311 | 0.01 | 0 | New | |
| Referendum | 310 | 0.01 | 0 | New | |
| Total | 6,072,051 | 100.00 | 150 | –72 | |
| Valid votes | 6,072,051 | 92.53 | |||
| Invalid/blank votes | 490,098 | 7.47 | |||
| Total votes | 6,562,149 | 100.00 | |||
| Registered voters/turnout | 7,199,440 | 91.15 | |||
| Source: Belgian Elections, Global Elections Database | |||||
Senate
| Party | Votes | % | Seats | |||||
|---|---|---|---|---|---|---|---|---|
| Won | Community | Co-opted | Total | |||||
| Christian People's Party | 1,009,656 | 16.85 | 7 | 3 | 2 | 12 | ||
| Flemish Liberals and Democrats | 796,154 | 13.29 | 6 | 2 | 2 | 10 | ||
| Socialistische Partij | 792,941 | 13.23 | 6 | 2 | 1 | 9 | ||
| Parti Socialiste | 764,610 | 12.76 | 5 | 4 | 2 | 11 | ||
| Liberal Reformist Party–Democratic Front of Francophones | 672,798 | 11.23 | 5 | 3 | 1 | 9 | ||
| Vlaams Blok | 463,896 | 7.74 | 3 | 1 | 1 | 5 | ||
| Christian Social Party | 434,492 | 7.25 | 3 | 3 | 1 | 7 | ||
| People's Union | 318,453 | 5.31 | 2 | 1 | 0 | 3 | ||
| Ecolo | 258,635 | 4.32 | 2 | 1 | 0 | 3 | ||
| Agalev | 223,355 | 3.73 | 1 | 1 | 0 | 2 | ||
| Aging with Dignity (Wallonia) | 32,913 | 0.55 | 0 | 0 | 0 | 0 | ||
| BANAAN | 31,956 | 0.53 | 0 | 0 | 0 | 0 | ||
| SAMUEL | 31,392 | 0.52 | 0 | 0 | 0 | 0 | ||
| VLAAMS | 22,632 | 0.38 | 0 | 0 | 0 | 0 | ||
| Workers' Party of Belgium (Flanders) | 21,607 | 0.36 | 0 | 0 | 0 | 0 | ||
| HOERA | 20,790 | 0.35 | 0 | 0 | 0 | 0 | ||
| Aging with Dignity (Flanders) | 20,426 | 0.34 | 0 | 0 | 0 | 0 | ||
| Workers' Party of Belgium (Wallonia) | 16,667 | 0.28 | 0 | 0 | 0 | 0 | ||
| United Left | 15,994 | 0.27 | 0 | 0 | 0 | 0 | ||
| Party of German-speaking Belgians | 13,762 | 0.23 | 0 | 0 | 0 | 0 | ||
| Parti Communautaire National-Européen | 10,058 | 0.17 | 0 | 0 | 0 | 0 | ||
| D | 7,567 | 0.13 | 0 | 0 | 0 | 0 | ||
| Flemish People's Party | 7,187 | 0.12 | 0 | 0 | 0 | 0 | ||
| Natural Law Party | 4,384 | 0.07 | 0 | 0 | 0 | 0 | ||
| Total | 5,992,325 | 100.00 | 40 | 21 | 10 | 71 | ||
| Valid votes | 5,992,325 | 91.32 | ||||||
| Invalid/blank votes | 569,783 | 8.68 | ||||||
| Total votes | 6,562,108 | 100.00 | ||||||
| Registered voters/turnout | 7,199,440 | 91.15 | ||||||
| Source: Belgian Elections, IPU | ||||||||

