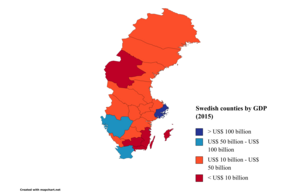
This is a list of Swedish Counties by GDP and GDP per capita.

List of Counties by GDP
Counties by GDP in 2015 according to data by the OECD.
| Rank | County | GDP (mil. SEK) |
GDP (mil. Int$ (PPP) |
|---|---|---|---|
| 1 | Stockholm | 1,340,350 | 149,771 |
| 2 | Västra Götaland | 711,221 | 79,472 |
| 3 | Skåne | 478,497 | 53,468 |
| 4 | Östergötland | 166,511 | 18,606 |
| 5 | Uppsala | 142,126 | 15,881 |
| 6 | Jönköping | 128,246 | 14,330 |
| 7 | Örebro | 104,338 | 11,659 |
| 8 | Halland | 102,150 | 11,414 |
| 9 | Norrbotten | 101,841 | 11,380 |
| 10 | Dalarna | 99,110 | 11,075 |
| 11 | Västmanland | 96,013 | 10,729 |
| 12 | Västerbotten | 95,948 | 10,721 |
| 13 | Gävleborg | 94,891 | 10,603 |
| 14 | Västernorrland | 91,309 | 10,203 |
| 15 | Värmland | 90,692 | 10,134 |
| 16 | Södermanland | 86,763 | 9,695 |
| 17 | Kalmar | 78,364 | 8,756 |
| 18 | Kronoberg | 75,801 | 8,470 |
| 19 | Blekinge | 52,847 | 5,905 |
| 20 | Jämtland | 43,073 | 4,813 |
| 21 | Gotland | 18,810 | 2,102 |
| 4,199,860 | 469,296 |
List of Counties by GDP per capita
Counties by GDP per capita in 2021 according to data by Statistics Sweden.
| Rank | County | GDP per capita in SEK | GDP per capita in USD (PPP) |
|---|---|---|---|
| 1 | Stockholm | 729,000 | 83,600 |
| 2 | Norrbotten | 648,000 | 74,300 |
| 3 | Västra Götaland | 517,000 | 59,300 |
| 4 | Kronoberg | 508,000 | 58,300 |
| 5 | Uppsala | 482,000 | 55,300 |
| 6 | Västerbotten | 473,000 | 54,200 |
| 7 | Jönköping | 472,000 | 54,100 |
| 8 | Västernorrland | 468,000 | 53,700 |
| 9 | Östergötland | 464,000 | 53,200 |
| 10 | Örebro | 456,000 | 52,300 |
| 11 | Skåne | 453,000 | 52,000 |
| 12 | Blekinge | 433,000 | 49,700 |
| 13 | Värmland | 426,000 | 48,900 |
| 14 | Dalarna | 425,000 | 48,700 |
| 15 | Jämtland | 422,000 | 48,300 |
| 16 | Västmanland | 415,000 | 47,600 |
| 17 | Halland | 409,000 | 46,900 |
| 18 | Gävleborg | 408,000 | 46,800 |
| 19 | Kalmar | 406,000 | 46,600 |
| 20 | Gotland | 379,000 | 43,500 |
| 21 | Södermanland | 378,000 | 43,300 |
| 527,000 | 60,400 |
References
- Regions and Cities > Regional Statistics > Regional Economy > Regional GDP per Capita, OECD.Stats. Accessed on 16 November 2018.
- "Regional GDP - Regionfakta". www.regionfakta.com (in Swedish). Retrieved 2024-02-23.
- "World Bank Open Data". PPP conversion factor, GDP (LCU per international $) - Sweden. Retrieved 2024-02-23.
| Lists of countries by GDP rankings | |
|---|---|
| Nominal | |
| Purchasing power parity (PPP) | |
| Growth rate | |
| Gross national income (GNI) | |
| Countries by region |
|
| Subnational divisions |
*Top country subdivisions by GDP *Top country subdivisions by GDP per capita *Top country metropolitan by GDP |