| This article needs additional citations for verification. Please help improve this article by adding citations to reliable sources. Unsourced material may be challenged and removed. Find sources: "Load profile" – news · newspapers · books · scholar · JSTOR (April 2009) (Learn how and when to remove this message) |


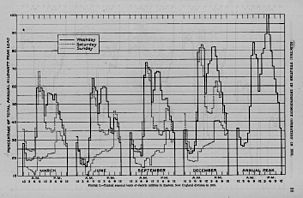
In electrical engineering, a load profile is a graph of the variation in the electrical load versus time. A load profile will vary according to customer type (typical examples include residential, commercial and industrial), temperature and holiday seasons. Power producers use this information to plan how much electricity they will need to make available at any given time. Teletraffic engineering uses a similar load curve.
Power generation
In a power system, a load curve or load profile is a chart illustrating the variation in demand/electrical load over a specific time. Generation companies use this information to plan how much power they will need to generate at any given time. A load duration curve is similar to a load curve. The information is the same but is presented in a different form. These curves are useful in the selection of generator units for supplying electricity.
Electricity distribution
In an electricity distribution grid, the load profile of electricity usage is important to the efficiency and reliability of power transmission. The power transformer or battery-to-grid are critical aspects of power distribution and sizing and modelling of batteries or transformers depends on the load profile. The factory specification of transformers for the optimization of load losses versus no-load losses is dependent directly on the characteristics of the load profile that the transformer is expected to be subjected to. This includes such characteristics as average load factor, diversity factor, utilization factor, and demand factor, which can all be calculated based on a given load profile.
On the power market so-called EFA blocks are used to specify the traded forward contract on the delivery of a certain amount of electrical energy at a certain time.
Retail energy markets
In retail energy markets, supplier obligations are settled on an hourly or subhourly basis. For most customers, consumption is measured on a monthly basis, based on meter reading schedules. Load profiles are used to convert the monthly consumption data into estimates of hourly or subhourly consumption in order to determine the supplier obligation. For each hour, these estimates are aggregated for all customers of an energy supplier, and the aggregate amount is used in market settlement calculations as the total demand that must be covered by the supplier.
Calculating and recording load profiles
Load profiles can be determined by direct metering but on smaller devices such as distribution network transformers this is not routinely done. Instead a load profile can be inferred from customer billing or other data. An example of a practical calculation used by utilities is using a transformer's maximum demand reading and taking into account the known number of each customer type supplied by these transformers. This process is called load research.
Actual demand can be collected at strategic locations to perform more detailed load analysis; this is beneficial to both distribution and end-user customers looking for peak consumption. Smart grid meters, utility meter load profilers, data logging sub-meters and portable data loggers are designed to accomplish this task by recording readings at a set interval.
See also
- Cost of electricity by source
- Duck curve
- Electricity generation
- Electric power transmission
- Electric power distribution
- Load duration curve
- Peak demand
- Vehicle-to-grid
- Unit commitment problem in electrical power production
- Duty cycle
References
- "E.ON UK Plans Giant Battery to Store Wind Power". Planet Ark. Archived from the original on September 18, 2007.
- Eromon, David I. (2005), "The Dynamics of Transformer Purchasing in a Transformed Electric Market", The International Journal of Modern Engineering, 6 (1)
