This is the results breakdown of the local elections held in Castile and León on 28 May 1995. The following tables show detailed results in the autonomous community's most populous municipalities, sorted alphabetically.
Overall
This section is empty. You can help by adding to it . (February 2021)
City control
The following table lists party control in the most populous municipalities, including provincial capitals (shown in bold ). Gains for a party are displayed with the cell's background shaded in that party's colour.
Municipality
Population
Previous control
New control
Ávila 49,639
People's Party (PP)
People's Party (PP)
Burgos 166,251
People's Party (PP)
People's Party (PP)
León 147,311
People's Party (PP)
People's Party (PP)
Palencia 79,561
Spanish Socialist Workers' Party (PSOE)
People's Party (PP)
Ponferrada
61,505
Spanish Socialist Workers' Party (PSOE)
People's Party (PP)
Salamanca 167,382
Spanish Socialist Workers' Party (PSOE)
People's Party (PP)
Segovia 55,372
People's Party (PP)
People's Party (PP)
Soria 33,317
People's Party (PP)
People's Party (PP)
Valladolid 336,917
Spanish Socialist Workers' Party (PSOE)
People's Party (PP)
Zamora 65,885
Spanish Socialist Workers' Party (PSOE)
People's Party (PP)
Municipalities
Ávila
Population: 49,639 Burgos
Population: 166,251
← Summary of the 28 May 1995 City Council of Burgos election results →
Parties and alliances
Popular vote
Seats
Votes
%
±pp
Total
+/−
People's Party (PP)
46,133
51.19
+8.86
16 +2
Spanish Socialist Workers' Party (PSOE)
15,680
17.40
–14.93
5 –6
United Left of Castile and León (IU)
14,126
15.67
+8.12
5 +3
Progress, Union and Freedom (PUL)
5,523
6.13
New
1 +1
Independent Solution (SI)
3,131
3.47
New
0
±0
Commoners' Land–Castilian Nationalist Party (TC–PNC)
1,933
2.14
+1.53
0
±0
Unity for Burgos (UPB)
748
0.83
New
0
±0
Burgalese Reality (RB)
561
0.62
New
0
±0
Blank ballots
2,285
2.54
+0.70
Total
90,120
27
±0
Valid votes
90,120
99.09
–0.11
Invalid votes
830
0.91
+0.11
Votes cast / turnout
90,950
68.13
+4.57
Abstentions
42,543
31.87
–4.57
Registered voters
133,493
Sources
León
Population: 147,311
← Summary of the 28 May 1995 City Council of León election results →
Parties and alliances
Popular vote
Seats
Votes
%
±pp
Total
+/−
People's Party (PP)
35,712
45.77
+5.16
14 +1
Spanish Socialist Workers' Party (PSOE)
17,130
21.95
–8.75
6 –4
Leonese People's Union (UPL)
16,888
21.64
+11.49
6 +3
United Left of Castile and León (IU)
5,051
6.47
+1.31
1 ±0
Independents for León (IPL)
1,360
1.74
New
0
±0
Leonese People for León (PREPAL)
223
0.29
New
0
±0
Humanist Platform (PH)
98
0.13
New
0
±0
Party of El Bierzo (PB)
49
0.06
New
0
±0
Blank ballots
1,517
1.94
–0.72
Total
78,028
27
±0
Valid votes
78,028
99.36
+0.35
Invalid votes
505
0.64
–0.35
Votes cast / turnout
78,533
67.51
+9.00
Abstentions
37,800
32.49
–9.00
Registered voters
116,333
Sources
Palencia
Population: 79,561 Ponferrada
Population: 61,505 Salamanca
Population: 167,382 Segovia
Population: 55,372 Soria
Population: 33,317
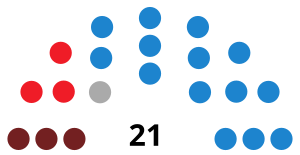
← Summary of the 28 May 1995 City Council of Soria election results →
Parties and alliances
Popular vote
Seats
Votes
%
±pp
Total
+/−
People's Party (PP)
7,283
45.13
–3.61
11 –1
Spanish Socialist Workers' Party (PSOE)
3,458
21.43
–11.35
5 –3
Independent Sorian Alternative (ALSI)
1,715
10.63
New
2 +2
United Left of Castile and León (IU)
1,549
9.60
+6.68
2 +2
Sorian Neighborhood Group (AVS)
1,110
6.88
New
1 +1
Centrist Union (UC)
307
1.90
–4.88
0
–1
Sorian Progressive Union (US)
241
1.49
New
0
±0
Blank ballots
475
2.94
+0.08
Total
16,138
21
±0
Valid votes
16,138
99.09
–0.12
Invalid votes
149
0.91
+0.12
Votes cast / turnout
16,287
60.96
+8.06
Abstentions
10,429
39.04
–8.06
Registered voters
26,716
Sources
Valladolid
Population: 336,917
← Summary of the 28 May 1995 City Council of Valladolid election results →
Parties and alliances
Popular vote
Seats
Votes
%
±pp
Total
+/−
People's Party (PP)
91,876
47.33
+6.59
15 +2
Spanish Socialist Workers' Party (PSOE)
65,622
33.80
–4.18
10 –2
United Left of Castile and León (IU)
26,788
13.80
+3.23
4 +1
Independent Candidacy of Valladolid (CIV)
2,132
1.10
New
0
±0
Independent Alliance (AI)
1,719
0.89
New
0
±0
Commoners' Land–Castilian Nationalist Party (TC–PNC)
587
0.30
New
0
±0
Platform of Independents of Spain (PIE)
529
0.27
New
0
±0
Regionalist Unity of Castile and León (URCL)
496
0.26
–0.64
0
±0
Communist Party of the Peoples of Spain (PCPE)
341
0.18
New
0
±0
Spanish Phalanx of the CNSO (FE–JONS)
318
0.16
–0.11
0
±0
Democratic and Social Centre (CDS)
n/a n/a –5.29
0
–1
Blank ballots
3,716
1.91
+0.04
Total
194,124
29
±0
Valid votes
194,124
99.22
+0.10
Invalid votes
1,519
0.78
–0.10
Votes cast / turnout
195,643
71.72
+11.61
Abstentions
77,149
28.28
–11.61
Registered voters
272,792
Sources
Footnotes:
Zamora
Population: 65,885 See also
References
^ "Elecciones Municipales en Castilla y León (1979-2019)" . Historia Electoral.com (in Spanish). Retrieved 21 October 2021.
"Elecciones Municipales. 28 de mayo de 1995. Castilla y León" . eldiario.es "28M/Elecciones Municipales 1995. Castilla y León" . Público ^ "Resumen de los resultados de las elecciones locales convocadas por Real Decreto 489/1995, de 3 de abril, y celebradas el 28 de mayo de 1995, según los datos que figuran en las actas de proclamación remitidas por cada una de las Juntas Electorales de Zona" (PDF) (in Spanish). Boletín Oficial del Estado . Retrieved 22 October 2021.
"Electoral Results Consultation. Municipal. May 1995. Ávila Municipality" . Ministry of the Interior "Electoral Results Consultation. Municipal. May 1995. Burgos Municipality" . Ministry of the Interior (in Spanish). Retrieved 7 June 2019."Electoral Results Consultation. Municipal. May 1995. León Municipality" . Ministry of the Interior (in Spanish). Retrieved 7 June 2019."Electoral Results Consultation. Municipal. May 1995. Palencia Municipality" . Ministry of the Interior (in Spanish). Retrieved 7 June 2019."Electoral Results Consultation. Municipal. May 1995. Ponferrada Municipality" . Ministry of the Interior (in Spanish). Retrieved 19 June 2020."Electoral Results Consultation. Municipal. May 1995. Salamanca Municipality" . Ministry of the Interior (in Spanish). Retrieved 7 June 2019."Electoral Results Consultation. Municipal. May 1995. Segovia Municipality" . Ministry of the Interior (in Spanish). Retrieved 7 June 2019."Electoral Results Consultation. Municipal. May 1995. Soria Municipality" . Ministry of the Interior (in Spanish). Retrieved 7 June 2019."Electoral Results Consultation. Municipal. May 1995. Valladolid Municipality" . Ministry of the Interior (in Spanish). Retrieved 7 June 2019."Electoral Results Consultation. Municipal. May 1995. Zamora Municipality" . Ministry of the Interior (in Spanish). Retrieved 7 June 2019.
Categories :
Results breakdown of the 1995 Spanish local elections (Castile and León)
Add topic
Text is available under the Creative Commons Attribution-ShareAlike License. Additional terms may apply.
**DISCLAIMER** We are not affiliated with Wikipedia, and Cloudflare.
The information presented on this site is for general informational purposes only and does not constitute medical advice.
You should always have a personal consultation with a healthcare professional before making changes to your diet, medication, or exercise routine.
AI helps with the correspondence in our chat.
We participate in an affiliate program. If you buy something through a link, we may earn a commission 💕
↑


