| This article may be too technical for most readers to understand. Please help improve it to make it understandable to non-experts, without removing the technical details. (December 2023) (Learn how and when to remove this message) |
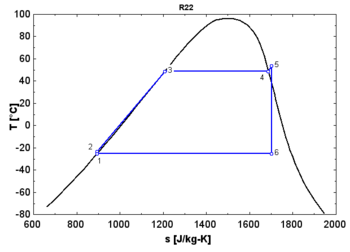
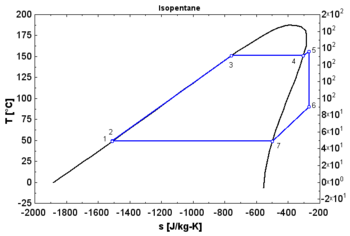
In thermodynamics, the saturation vapor curve is the curve separating the two-phase state and the superheated vapor state in the T–s diagram (temperature–entropy diagram).
The saturated liquid curve is the curve separating the subcooled liquid state and the two-phase state in the T–s diagram.
When used in a power cycle, the fluid expansion depends strongly on the nature of this saturation curve:
- A "wet" fluid shows a negative saturation vapor curve. If overheating before the expansion is limited, a two-phase state is obtained at the end of the expansion.
- An "isentropic" fluid shows a vertical saturation vapor curve. It remains very close to the saturated vapor state after an hypothetical isentropic expansion.
- A "dry" fluid shows a positive saturation vapor curve. It is in dry vapor state at the end of the expansion, and strongly overheated.
See also
References
- A New Phase Diagram: The T-S Diagram at LearnThermo.com
This thermodynamics-related article is a stub. You can help Misplaced Pages by expanding it. |


