Misplaced Pages

2000 United States House of Representatives elections in New Hampshire

Article snapshot taken from[REDACTED] with creative commons attribution-sharealike license. Give it a read and then ask your questions in the chat. We can research this topic together.
(Redirected from United States House of Representatives elections in New Hampshire, 2000)

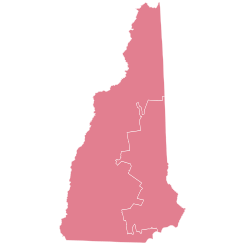
2000 United States House of Representatives elections in New Hampshire

← 1998 November 7, 2000 2002 →

All 2 New Hampshire seats to the United States House of Representatives
  Majority party Minority party
 
Party Republican Democratic
Last election 2 0
Seats won 2 0
Seat change Steady Steady
Popular vote 303,190 238,754
Percentage 54.53% 42.94%
Swing Decrease5.36% Increase3.89%

Republican

  50–60%

Elections in New Hampshire
Federal government
Presidential elections
Presidential primaries
Democratic
1952
1956
1960
1964
1968
1972
1976
1980
1984
1988
1992
1996
2000
2004
2008
2012
2016
2020
2024
Republican
1952
1956
1960
1964
1968
1972
1976
1980
1984
1988
1992
1996
2000
2004
2008
2012
2016
2020
2024
Local
United States Senate elections
United States House elections
State government
Gubernatorial elections
Executive Council elections
General Court elections
Senate elections
House elections
Manchester
Mayoral elections
  • 19th century
    • 1846
    • 1847
    • 1848
    • 1849
    • 1850
    • 1851
    • 1852
    • 1853
    • 1854
    • 1855
    • 1856 (Mar)
    • 1856 (Nov)
    • 1857
    • 1858
    • 1859
    • 1860
    • 1861
    • 1862
    • 1863
    • 1864
    • 1865
    • 1866
    • 1867
    • 1868
    • 1869
    • 1870
    • 1871
    • 1872
    • 1873
    • 1875
    • 1876
    • 1877
    • 1878 (Mar)
    • 1878 (Nov)
    • 1880
    • 1882
    • 1884
    • 1886
    • 1888
    • 1890
    • 1892
    • 1894
    • 1896
    • 1898
    • 1900

  • 20th century
    • 1902
    • 1904
    • 1906
    • 1908
    • 1910
    • 1912
    • 1914
    • 1915
    • 1917
    • 1919
    • 1921
    • 1923
    • 1925
    • 1927
    • 1929
    • 1931
    • 1933
    • 1935
    • 1937
    • 1939
    • 1941
    • 1943
    • 1945
    • 1947
    • 1949
    • 1951
    • 1953
    • 1955
    • 1957
    • 1959
    • 1961
    • 1963
    • 1965
    • 1967
    • 1969
    • 1971
    • 1973
    • 1975
    • 1977
    • 1979
    • 1981
    • 1983
    • 1985
    • 1987
    • 1989
    • 1991
    • 1993
    • 1995
    • 1997
    • 1999

  • 21st century
    • 2001
    • 2003
    • 2005
    • 2007
    • 2009
    • 2011
    • 2013
    • 2015
    • 2017
    • 2019
    • 2021
    • 2023

The 2000 congressional elections in New Hampshire were held on November 7, 2000, to determine who will represent the state of New Hampshire in the United States House of Representatives. It coincided with the state's gubernatorial elections. Representatives are elected for two-year terms; those elected served in the 107th Congress from January 2001 until January 2003. New Hampshire has two seats in the House, apportioned according to the 2000 United States census.

Overview

United States House of Representatives elections in New Hampshire, 2000
Party Votes Percentage Seats +/–
Republican 303,190 54.53% 2 -
Democratic 238,754 42.94% 0 -
Libertarian 11,901 2.14% 0 -
Constitution 2,204 0.40% 0 -
Totals 556,049 100.00% 2 -

References

  1. Clerk of the U.S. House of Representatives. "Statistics of the Presidential and Congressional Election of November 7, 2000" (PDF). U.S. Government Printing Office. p. 40.
(1999 ←)   2000 United States elections   (→ 2001)
President
U.S.
Senate
U.S.
House
State
governors
Attorneys
General
State
legislature
Mayors
Elections in New Hampshire
Presidential elections
Senate elections
Class 2
Class 3
House elections
Gubernatorial elections
Legislative elections
State Senate
State House
Categories:
2000 United States House of Representatives elections in New Hampshire Add topic