(Redirected from United States presidential election in Arkansas, 1968 )
Main article: 1968 United States presidential election
1968 United States presidential election in Arkansas
Wallace
30–40%
40–50%
50–60%
70–80%
Nixon
30–40%
40–50%
50–60%
Humphrey
30–40%
40–50%
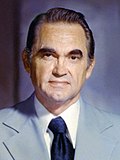
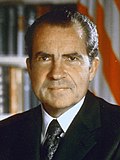
The 1968 United States presidential election in Arkansas was held on November 5, 1968 as part of the 1968 United States presidential election . American Independent candidate George Wallace won the state of Arkansas with 235,627 votes, with Republican Richard Nixon winning 189,062 and Democrat Hubert Humphrey winning 184,901.
With 38.87% of the popular vote, Arkansas would prove to be Wallace's weakest state that he carried in the 1968 election after Alabama , Mississippi , Louisiana and Georgia . This was the first time since 1872 that Arkansas did not vote for the Democratic candidate, and would be the last time until 2008 that Arkansas did not back the winner of the presidential election. As of 2024 , this remains the last time that a Republican has won the presidency without carrying Arkansas.
46% of white voters supported Wallace, 36% supported Nixon, and 19% supported Humphrey.
Results
Results by county
County
George Wallace
Richard Nixon
Hubert Humphrey
Margin
Total votes cast
#
%
#
%
#
%
#
%
Arkansas
3,775
49.67%
1,806
23.76%
2,019
26.57%
1,756
23.10%
7,600
Ashley
4,401
55.67%
1,470
18.59%
2,035
25.74%
2,366
29.93%
7,906
Baxter
1,513
22.04%
3,401
49.53%
1,952
28.43%
-1,449
-21.10%
6,866
Benton
4,036
24.87%
8,104
49.94%
4,088
25.19%
-4,016
-24.75%
16,228
Boone
2,169
29.21%
3,349
45.10%
1,907
25.68%
-1,180
-15.89%
7,425
Bradley
2,546
52.99%
802
16.69%
1,457
30.32%
1,089
22.67%
4,805
Calhoun
1,215
55.48%
287
13.11%
688
31.42%
527
24.06%
2,190
Carroll
1,174
23.16%
2,596
51.22%
1,298
25.61%
-1,298
-25.61%
5,068
Chicot
2,187
38.73%
865
15.32%
2,595
45.95%
-408
-7.22%
5,647
Clark
2,776
38.82%
1,642
22.96%
2,733
38.22%
43
0.60%
7,151
Clay
2,285
35.94%
2,410
37.91%
1,663
26.16%
-125
-1.97%
6,358
Cleburne
1,657
39.83%
1,301
31.27%
1,202
28.89%
356
8.56%
4,160
Cleveland
1,751
70.89%
312
12.63%
407
16.48%
1,344
54.41%
2,470
Columbia
3,843
46.60%
1,916
23.24%
2,487
30.16%
1,356
16.44%
8,246
Conway
1,958
30.16%
1,973
30.40%
2,560
39.44%
-587
-9.04%
6,491
Craighead
6,742
43.42%
5,047
32.50%
3,738
24.07%
1,695
10.92%
15,527
Crawford
2,917
40.41%
2,723
37.73%
1,578
21.86%
194
2.68%
7,218
Crittenden
4,657
43.99%
2,454
23.18%
3,475
32.83%
1,182
11.16%
10,586
Cross
3,056
53.58%
1,093
19.16%
1,555
27.26%
1,501
26.32%
5,704
Dallas
1,722
47.22%
672
18.43%
1,253
34.36%
469
12.86%
3,647
Desha
2,474
43.28%
972
17.00%
2,270
39.71%
204
3.57%
5,716
Drew
2,307
49.39%
1,040
22.27%
1,324
28.35%
983
21.04%
4,671
Faulkner
4,375
40.06%
2,791
25.55%
3,756
34.39%
619
5.67%
10,922
Franklin
2,111
45.96%
1,333
29.02%
1,149
25.02%
778
16.94%
4,593
Fulton
1,080
32.76%
1,198
36.34%
1,019
30.91%
-118
-3.58%
3,297
Garland
6,955
34.29%
7,674
37.83%
5,655
27.88%
-719
-3.54%
20,284
Grant
2,194
59.73%
627
17.07%
852
23.20%
1,342
36.53%
3,673
Greene
3,021
37.40%
2,859
35.40%
2,197
27.20%
162
2.00%
8,077
Hempstead
3,136
43.31%
1,783
24.62%
2,322
32.07%
814
11.24%
7,241
Hot Spring
4,139
51.38%
1,780
22.10%
2,137
26.53%
2,002
24.85%
8,056
Howard
1,660
41.43%
1,286
32.09%
1,061
26.48%
374
9.34%
4,007
Independence
2,770
35.33%
2,782
35.48%
2,289
29.19%
-12
-0.15%
7,841
Izard
1,109
37.12%
931
31.16%
948
31.73%
161
5.39%
2,988
Jackson
3,525
50.85%
1,356
19.56%
2,051
29.59%
1,474
21.26%
6,932
Jefferson
10,053
41.82%
4,860
20.22%
9,125
37.96%
928
3.86%
24,038
Johnson
1,693
33.15%
1,667
32.64%
1,747
34.21%
-54
-1.06%
5,107
Lafayette
1,704
47.54%
672
18.75%
1,208
33.71%
496
13.83%
3,584
Lawrence
2,813
45.27%
1,788
28.77%
1,613
25.96%
1,025
16.50%
6,214
Lee
1,907
39.11%
834
17.10%
2,135
43.79%
-228
-4.68%
4,876
Lincoln
2,084
55.12%
488
12.91%
1,209
31.98%
875
23.14%
3,781
Little River
1,473
44.50%
745
22.51%
1,092
32.99%
381
11.51%
3,310
Logan
2,160
33.24%
2,341
36.02%
1,998
30.74%
-181
-2.78%
6,499
Lonoke
4,002
52.02%
1,677
21.80%
2,014
26.18%
1,988
25.84%
7,693
Madison
1,028
20.89%
2,320
47.14%
1,574
31.98%
-746
-15.16%
4,922
Marion
877
26.97%
1,385
42.59%
990
30.44%
-395
-12.15%
3,252
Miller
5,062
47.52%
2,662
24.99%
2,929
27.49%
2,133
20.03%
10,653
Mississippi
6,147
39.64%
4,369
28.17%
4,993
32.19%
1,154
7.45%
15,509
Monroe
2,406
48.19%
804
16.10%
1,783
35.71%
623
12.48%
4,993
Montgomery
992
39.27%
885
35.04%
649
25.69%
107
4.23%
2,526
Nevada
1,773
45.22%
840
21.42%
1,308
33.36%
465
11.86%
3,921
Newton
567
19.65%
1,467
50.83%
852
29.52%
-615
-21.31%
2,886
Ouachita
5,031
42.48%
2,209
18.65%
4,603
38.87%
428
3.61%
11,843
Perry
916
40.00%
740
32.31%
634
27.69%
176
7.69%
2,290
Phillips
4,279
37.30%
2,154
18.78%
5,039
43.92%
-760
-6.62%
11,472
Pike
1,535
46.59%
1,104
33.51%
656
19.91%
431
13.08%
3,295
Poinsett
4,074
51.66%
2,140
27.14%
1,672
21.20%
1,934
24.52%
7,886
Polk
1,812
34.87%
2,094
40.30%
1,290
24.83%
-282
-5.43%
5,196
Pope
2,769
31.95%
3,319
38.30%
2,578
29.75%
-550
-6.35%
8,666
Prairie
2,014
56.23%
693
19.35%
875
24.43%
1,139
31.80%
3,582
Pulaski
25,844
32.24%
26,709
33.32%
27,597
34.43%
-888
-1.11%
80,150
Randolph
1,610
38.21%
1,237
29.35%
1,367
32.44%
243
5.77%
4,214
St. Francis
4,254
46.51%
1,608
17.58%
3,284
35.91%
970
10.60%
9,146
Saline
5,569
49.31%
2,614
23.15%
3,111
27.55%
2,458
21.76%
11,294
Scott
1,238
36.41%
1,162
34.18%
1,000
29.41%
76
2.23%
3,400
Searcy
726
21.61%
1,909
56.83%
724
21.55%
-1,183
-35.22%
3,359
Sebastian
8,649
31.98%
12,073
44.65%
6,320
23.37%
-3,424
-12.67%
27,042
Sevier
1,501
39.02%
1,217
31.64%
1,129
29.35%
284
7.38%
3,847
Sharp
1,299
37.54%
1,136
32.83%
1,025
29.62%
163
4.71%
3,460
Stone
979
36.75%
987
37.05%
698
26.20%
-8
-0.30%
2,664
Union
7,853
45.66%
4,919
28.60%
4,426
25.74%
2,934
17.06%
17,198
Van Buren
1,224
33.10%
1,325
35.83%
1,149
31.07%
-101
-2.73%
3,698
Washington
5,092
23.29%
10,640
48.67%
6,131
28.04%
-4,509
-20.63%
21,863
White
5,054
41.63%
3,887
32.02%
3,198
26.34%
1,167
9.61%
12,139
Woodruff
1,734
47.78%
625
17.22%
1,270
35.00%
464
12.78%
3,629
Yell
1,949
36.91%
1,819
34.44%
1,513
28.65%
130
2.47%
5,281
Totals
235,627
38.65%
189,062
31.01%
184,901
30.33%
46,565
7.64%
609,590
Counties that flipped from Democratic to Republican
Counties that flipped from Democratic to American Independent
Counties that flipped from Republican to American Independent
See also
Notes
References
Leip, David. "1968 Presidential General Election Results – Arkansas" . uselectionatlas.org . Retrieved April 24, 2017.
"1968 Presidential Election Statistics" . Dave Leip’s Atlas of U.S. Presidential Elections. Retrieved March 5, 2018."Dave Leip's Atlas of U.S. Presidential Elections" . uselectionatlas.org . Retrieved November 23, 2023.Black & Black 1992 , p. 147.
Black & Black 1992 , p. 295.
Black & Black 1992 , p. 335.
Gans, Curtis (2011). Voter Turnout in the United States, 1788-2009 ISBN 9781604265958
Works cited
Categories :
1968 United States presidential election in Arkansas
Add topic
Text is available under the Creative Commons Attribution-ShareAlike License. Additional terms may apply.
**DISCLAIMER** We are not affiliated with Wikipedia, and Cloudflare.
The information presented on this site is for general informational purposes only and does not constitute medical advice.
You should always have a personal consultation with a healthcare professional before making changes to your diet, medication, or exercise routine.
AI helps with the correspondence in our chat.
We participate in an affiliate program. If you buy something through a link, we may earn a commission 💕
↑
 County Results


