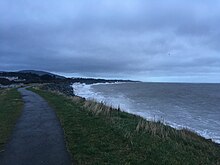

Wave run-up is the height to which waves run up the slope of a revetment, bank or dike, regardless of whether the waves are breaking or not. Conversely, wave run-down is the height to which waves recede. These heights are always measured vertically (and not along the slope). The wave run-up height, denoted by , , or , is a very important parameter in coastal engineering as, together with the design highest still water level, it determines the required crest height of a dike or revetment.
History
The first scientific measurements of wave run-up were carried out by the Lorentz Committee in preparation for the works to close off the Zuiderzee. The Committee measured the wave height and wave run-up at various locations in 1920, but established that state of the art methods for measuring waves in the field during storms were inadequate. As a result, scale tests were also undertaken, but these also proved to be of very limited efficacy due to the fact that only regular waves (idealised, periodic waves with constant amplitude and a fixed time period between successive wave crests, following a sinusoidal pattern) could be modelled at the time.
The methods and technology available to the committee at the time did not permit model testing of the more realistic and complex irregular waves (consisting of varying heights, periods and directions), which provide a more accurate representation of the actual conditions faced by coastal structures and shorelines.
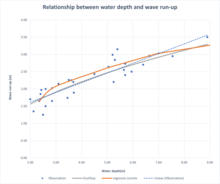
It was found, however, that the depth in front of the dike is very important for wave run-up and that, at least for the range of observations in the committee's measurements, the slope ratio does not play a major role. Nearly all dikes in the Netherlands at that time had a slope of 1:3.
Current knowledge indicates that during storms and on gentle coastal slopes, the significant wave height is approximately half the water depth. This relationship appears to be accurate, and the observation is more pronounced for slopes around 1:3.
This research was continued during the Zuiderzee Works, and eventually led to the (old) Delft formula for wave run-up:
in which:
- is the run-up,
- is the (regular) wave height at the toe and
- is the slope of the construction under consideration.
This formula proved to be generally applicable for smooth slopes and relatively steep (storm) waves. Subsequently, it was discovered that longer (swell) waves resulted in higher run-up. To account for this, the wave period was incorporated into the formula using the Iribarren number, , leading to the development of Hunt's Formula:
This formula was also valid for regular waves. The Old Delft Formula and Hunt's Formula are identical for waves with a steepness of 1/64, or about 2%. For higher values of , Hunt's formula has a limit value: .
van der Meer, TAW and continuing development of formulae
In 1988, van der Meer provided formulae for wave run-up on rubble mound breakwaters, based on tests with rock-armoured straight slopes. He also introduced a notional permeability factor for the structure. This factor also accounts for the effect of the pore volume. Defining at the run-up level of exceedance probability , the formula, valid for and head-on waves, is:
The term reaches a constant maximum value equal to in the case of permeable structures, i.e., . This corresponds to the region of surging waves, where there is no real wave breaking and where wave steepness and slope angle do not influence the run-up. The coefficients and are presented in the table below:
| Run-up exceedance probability level, p% |
a | b | c | d |
|---|---|---|---|---|
| 0.1 | 1.12 | 1.34 | 0.55 | 2.58 |
| 2 | 0.96 | 1.17 | 0.46 | 1.97 |
| 5 | 0.86 | 1.05 | 0.44 | 1.68 |
| 10 | 0.77 | 0.94 | 0.42 | 1.45 |
| 50 | 0.47 | 0.60 | 0.34 | 0.82 |
The values of the coefficients highlight the considerable variability of the run-up level from one wave to another in irregular seas. For run-up levels on smooth slopes, work in the Netherlands by the Technische Adviescommissie voor de Waterkeringen (English: Technical Advisory Committee on water Defences) in 1974 discussed the reduction in run-up due to different types of surface roughness.
Irregular waves
In practical scenarios, waves are irregular, consisting of a combination of waves with varying heights, periods, and directions. These waves are typically analysed using statistical methods and spectral analysis, providing a more accurate representation of the actual conditions faced by coastal structures and shorelines. Consequently, it is not possible to define a single wave run-up value. Instead, a wave run-up with a specific probability of exceedance is used, typically set at 2%. This wave run-up represents the height exceeded by 2% of the waves in a wave field.
Research indicates that wave run-up follows a Rayleigh distribution, similar to the waves themselves. A probability of exceedance value has been chosen that is small enough to prevent overtopping waves from causing damage to the inner slope. The 2% value has been adopted internationally and was arbitrarily selected by the Dutch Waterloopkundig Laboratorium shortly before 1940. Considering the function, 1% or 5% could have also been possible. The choice of 2% was based on the duration of experimental designs, as a complete trial could be conducted in half a day.
In 1972, Jurjen Battjes, commissioned by the Dutch Technical Advisory Committee for Flood Defences, summarised the available research and provided a solid theoretical foundation. This work led to an improved version of Hunt's Formula, which explicitly included parameters for the angle of incidence of the waves, the effect of a berm, and the slope's roughness. However, the available experimental data on roughness and the berm were insufficient to establish a definitive formula.
Subsequent research was conducted in the following years, with an emphasis on wave overtopping as a more indicative factor for dike height than wave run-up. This research ultimately resulted in a Technical Report in 2002 by the Dutch organisation, TAW. The wave run-up formula mentioned in this report remains in use, and the EurOtop manual has adopted it. The scope of validity has been further expanded in the EurOtop manual, featuring modified formulas.
Modern wave run-up formulas


,
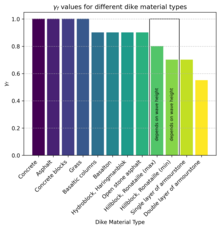
where is the reduction coefficient and is the Iribarren number. Different materials exhibit varying roughness factors, influencing the wave run-up height. This graph compares the wave run-up for double layer armourstone, single layer armourstone, and asphalt for a breakwater with T=6s, Lo=100m, =0 and berm width =3m.
The EurOtop manual provides a general formula (Formula 1.4 in the manual) for wave run-up:
with a maximum value around 3. The Iribarren number is then used based on the period determined using the first negative moment of the wave spectrum. Additionally, is the reduction coefficient for the factors described below.
The following equation is valid:
in which:
- is the reduction by the berm. A berm is especially effective when it is placed on still water level (i.e. design water level). For a typical Dutch dike (slope 1:3, steep waves) the following equation is valid: , in which is the width of the berm. The acceptable range for this is .
- is a reduction for obliquely approaching waves, , in which is the approach angle of the waves in degrees (0° being a perpendicular approach)
- is the effect of roughness. One may use the following table for this factor:
Reference type Concrete 1.0 Asphalt 1.0 Concrete blocks 1.0 Grass 1.0 Basaltic columns 0.90 Basalton 0.90 Hydroblock, Haringmanblok 0.90 Open stone asphalt 0.90 Hillblock, Ronataille 0.70 - 0.80 Single layer of armourstone 0.70 Double layer of armourstone 0.55
A range is provided for Hillblock and Ronataille materials, as their reduction coefficient is dependent on wave height. A similar phenomenon occurs with grass. When subjected to high waves, natural grass becomes very smooth, resulting in a reduction coefficient . However, for smaller waves — approximately 25 centimetres (9.8 in) or less — natural grass tends to be much rougher. In such cases, one may opt for a reduction coefficient of below 1.0.
When dealing with short-crested waves, the highest run-up is caused by head-on waves (those with an angle of incidence, ) and equates to the run-up for long-crested waves. For smooth slopes, the run-up decreases slightly with . The run-down typically ranges between a third and a half of the run-up. For breakwaters and revetments constructed with rock armour, the maximum run-down level may indicate the minimum downward extension of the primary armour, and a potential upper level for introducing a berm with a smaller armour size.
Wave run-down
For wave run-down there is a similar formula:
Flood mark
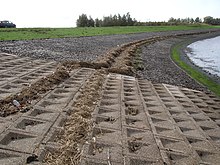
Following storm events, a layer of floating debris, known as the flood mark or flotsam, often remains on the slope. This tide mark indicates the maximum wave run-up during the preceding storm. As the flood mark is situated near the height of maximum wave run-up and water levels are generally well-documented by nearby tide stations, it is straightforward to calculate the Ru2% of the storm by subtracting the observed storm surge level from the flood mark level.
In the past, authorities in the Netherlands systematically recorded these observations for most dikes, resulting in a collection of flood mark heights for each dike section. The statistics of flood mark heights can be utilised to determine dike height, which should comprise the design water level plus a safety height (freeboard). The freeboard at the design water level must be equal to the maximum permissible wave run-up.
For a dike with an acceptable load exceedance probability per year, such as 1/500 (as with the temporary dike reinforcement in the Oosterschelde), it is necessary to determine the 1/500 wave run-up. This can be calculated if the 1/500 wave height at the toe of the dike is known. However, this value is rarely measured and must be determined using a computational model, such as SWAN. In many instances, this process can be challenging and prone to errors.
By analysing flood mark heights, which involves simply plotting the data on logarithmic paper, it is possible to directly obtain values such as the 1/500 wave run-up, and consequently the required safety height. An example of this can be observed in the accompanying photo of the run-up and flood mark lines at a dike along the Bathpolder in Zeeland. The photo shows two flood mark lines, which represent the wave run-up of two subsequent storms (on October 12, 2009, with water levels at 2.2 metres (7 ft 3 in) and 1.9 metres (6 ft 3 in) above mean sea level) in the Bathpolder. In the foreground, there is a slope with Haringman blocks, while the background features a slope of Elastocoast. The wave height during these storms was approximately 0.5 metres (1 ft 7.7 in). The wave run-up was 0.8 and 0.85 metres (2 ft 7 in and 2 ft 9 in) above the storm surge level on the Elastocoast, and 1.05 and 1.1 metres (3 ft 5 in and 3 ft 7 in) above the storm surge level on the Haringman blocks. The slope gradient here is 1:4.2. As a Haringman block measures exactly 50 centimetres (19.7 in), the run-up can be assessed in this photo. Subsequent analysis reveals that the reduction coefficient γf for Haringman blocks here is 1.0, and for Elastocoast, it is 0.8.
Wave run-up simulation
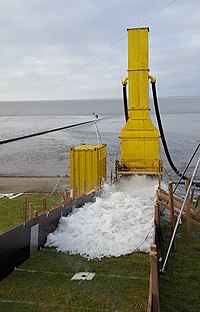
To assess the safety of a dike and the durability of its grass cover, particularly on the sea or river side, a wave run-up simulator can be employed. The wave conditions for which a dike is designed are infrequent, and the strength of grass coverings varies. These dike conditions can be replicated in-situ using a wave run-up simulator, allowing the manager of the relevant flood defence system to determine if the grass cover is strong enough to withstand expected waves under extreme conditions.
During these tests, the wave run-up simulator is placed on the outer slope and continuously filled with water at a constant flow rate. The flaps at the bottom of the simulator can be opened to varying extents, enabling the simulation of different wave run-up volumes.
The wave run-up simulator is one method for assessing the strength of the grass cover. Another approach involves using a sod puller, which can determine the tensile strength of a sod and allows conversion of this tensile strength by an engineer into a strength under load caused by wave run-up. In addition to simulating wave run-up, the simulation of wave impacts and wave overtopping can be achieved using specifically designed generators and simulators.
Note
Wave run-up should not be confused with wave set-up (an increase in water level due to known waves) or with wind setup (storm surge, an increase in water level due to the driving force of wind).
References
General reference
- Van der Meer, J.W.; Allsop, N.W.H.; Bruce, T.; De Rouck, J.; Kortenhaus, A.; Pullen, T.; Schüttrumpf, H.; Troch, P.; Zanuttigh, B. (2018): EurOtop. Manual on wave overtopping of sea defences and related structures. An overtopping manual largely based on European research, but for worldwide application, Rijkswaterstaat & Environment Agency
- Lorentz, H.A.; Wortman; van Everdingen; Stoep (September 1926). "hoofdstuk 8". Verslag van de staatscommissie met opdracht te onderzoeken in hoeverre, als gevolg de afsluiting van de Zuiderzee te verwachten is dat tijdens storm hogere waterstanden en een grotere golfoploop, dan thans het geval is, zullen voorkomen vóór de kust van het vaste land van Noord-Holland, Friesland en Groningen, alsmede vóór de daarvoor gelegen Noordzee-eilanden [report of the state commission to investigate in how far closing of the Zuiderzee causes higher wave run-up along the coast of North-Holland, Friesland and Groningen] (in Dutch). Landsdrukkerij,, Den Haag. pp. 249–258.
- Thijsse, J.Th. (1935). Nota betreffende den golfoploop [Memorandum regarding wave run-up] (in Dutch) (Nota ZZW nr. 89 ed.). Rijkswaterstaat, Dienst Zuiderzeewerken.
- Hunt Jr., I.A. (1959). "Design of Seawalls and Breakwaters". Journal of the Waterways and Harbors Division. 85 (3): 123–152. doi:10.1061/JWHEAU.0000129. hdl:2027/uc1.31822032677668. Retrieved 14 April 2023 – via America Society of Civil Engineers (ASCE).
- Van der Meer, J.W. (1988). Rock slopes and gravel beaches under wave attack (PhD). Delft University of Technology.
- ^ Abbott, M.B.; Price, W.A. (1994). Coastal, Estuarial and Harbour Engineer's Reference Book (2nd ed.). CRC Press. pp. 395–397. ISBN 978-0-419-15430-3.
- Burcharth, H.F. (1994). "The Design of Breakwaters". In Abbott, M.B.; Price, W.A. (eds.). Coastal, Estuarial and Harbour Engineers' Reference Book. Boca Raton, FL: CRC Press. pp. 381–424. ISBN 9780367864644.
- van der Meer, J.W. (1998). "Wave run-up and overtopping". Dikes and Revetments. Routledge. doi:10.1201/9781315141329. ISBN 978-1-315-14132-9.
- Battjes, Jurjen (1972). Wave run-up and overtopping. Technische Adviescommissie voor de Waterkeringen (TAW)/ Rijkswaterstaat, 's-Gravenhage. p. 188.
- Battjes, J.A. (1974). Computation of set-up, longshore currents, run-up and overtopping due to wind-generated waves (PhD). Delft University of Technology. Retrieved 11 April 2023.
- ^ van der Meer, Jentsje (May 2002). Technisch rapport golfoploop en golfoverslag bij dijken [Technical report on wave run-up and overtopping on dikes] (in Dutch). Technische Adviescommissie voor de Waterkeringen (TAW)/ Rijkswaterstaat, Delft. p. 53.
- ^ van der Meer, J.W.; Allsop, N.W.H.; Bruce, T.; De Rouck, J.; Kortenhaus, A.; Pullen, T.; Schüttrumpf, H.; Troch, P.; Zanuttigh, B. (2018). EurOtop Manual on wave overtopping of sea defences and related structures. Second Edition 2018 (PDF). Retrieved 11 April 2023.
- Blenkinsopp, C.E.; Matias, A.; Howe,D.; Castelle, B.; Marieu, I.; Turner, L. (July 2016). "Wave runup and overwash on a prototype-scale sand barrier". Coastal Engineering. 113: 88–103. doi:10.1016/j.coastaleng.2015.08.006.
- Kuin, R.A.; Stroband, H.J. (1946). Overzicht van de Zeeuwsche hoofdwaterkeeringen [Overview main sea defence in the province Zeeland] (in Dutch). Rijkswaterstaat, dir. Benedenrivieren, studiedienst.
- Verhagen, H.J. "Swan and SwanOne". TU Delft. Retrieved 2023-04-14.
- Steendam, G.J.; Van der Meer, J.W.; Van Hoven, A.; Labrujere, A. (2017). "Wave Run-up Simulations on Real Dikes". Int. Conf. On Coastal Engineering. 2016.
- Bijlaard, R.W. (12 June 2015). Strength of the grass sod on dikes during wave overtopping. TU Delft, Hydraulic engineering.
 ,
,  , or
, or  , is a very important parameter in
 is the run-up,
 is the (regular) wave height at the toe and
 is the slope of the construction under consideration.
 , leading to the development of Hunt's Formula:


 .
.
 for the structure. This factor also accounts for the effect of the pore volume. Defining
  at the run-up level of exceedance probability
  , the formula, valid for
  and head-on waves, is:

 reaches a constant maximum value equal to
  in the case of permeable structures, i.e.,
  . This corresponds to the region of surging waves, where there is no real wave breaking and where wave steepness and slope angle do not influence the run-up. The coefficients
 and
and  ,
, is the reduction coefficient and
  is the Iribarren number. Different materials exhibit varying roughness factors, influencing the wave run-up height. This graph compares the wave run-up for double layer armourstone, single layer armourstone, and asphalt for a breakwater with T=6s, Lo=100m,
  =0 and berm width =3m.

 is the reduction by the berm. A berm is especially effective when it is placed on still water level (i.e. design water level). For a typical Dutch dike (slope 1:3, steep waves) the following equation is valid:
  , in which
  is the width of the berm. The acceptable range for this is
  .
. is a reduction for obliquely approaching waves,
  , in which
  is the effect of roughness. One may use the following table for this factor:
 . However, for smaller waves — approximately 25 centimetres (9.8 in) or less — natural grass tends to be much rougher. In such cases, one may opt for a reduction coefficient of
  ) and equates to the run-up for long-crested waves. For smooth slopes, the run-up decreases slightly with