| Revision as of 09:18, 14 August 2024 edit2a02:842a:854f:901:bd6:1f49:824c:24a1 (talk) Added more information about the programTag: Reverted← Previous edit | Revision as of 11:21, 14 August 2024 edit undoMrOllie (talk | contribs)Extended confirmed users, Pending changes reviewers, Rollbackers238,626 edits Restored revision 1240078872 by Quosta (talk)Tags: Twinkle UndoNext edit → | ||
| Line 25: | Line 25: | ||
| It has a ], a ] and an interactive and animated ] to mathematical and statistical packages and programming languages. | It has a ], a ] and an interactive and animated ] to mathematical and statistical packages and programming languages. | ||
| == History == | |||
| This program was started by Stefan Gerlach in 2001 under the name Qplot. Its initial 1.0 release is date 2003. It has undergone a large rewrite released under the name labplot 2.0 in 2014. As of 2024 the latest version is numbered 2.11, released in july 2024. | |||
| == Features == | |||
| Labplot is project oriented, that is not only aimed at producing plots, but instead its goal is to produce complete notebooks, encompassing large amount of data and letting users manipulate and analyze it through a very large set of tools : | |||
| * Visualization tools; | |||
| * statistics; | |||
| * Data analysis (e.g. regressions, Hilbert transform, etc); | |||
| * Interface to mathematical and programming languages (e.g. Maxima, R, Octave, scilab, Python, Lua, etc); | |||
| * Data extraction from plots. | |||
| == External links == | == External links == | ||
Revision as of 11:21, 14 August 2024
Application for interactive graphing and analysis of scientific data| The topic of this article may not meet Misplaced Pages's general notability guideline. Please help to demonstrate the notability of the topic by citing reliable secondary sources that are independent of the topic and provide significant coverage of it beyond a mere trivial mention. If notability cannot be shown, the article is likely to be merged, redirected, or deleted. Find sources: "LabPlot" – news · newspapers · books · scholar · JSTOR (July 2024) (Learn how and when to remove this message) |
| A major contributor to this article appears to have a close connection with its subject. It may require cleanup to comply with Misplaced Pages's content policies, particularly neutral point of view. Please discuss further on the talk page. (July 2024) (Learn how and when to remove this message) |
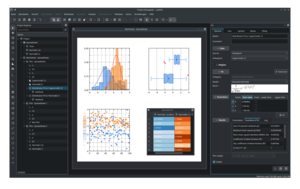
 Screenshot of LabPlot of 2022 Screenshot of LabPlot of 2022 | |
| Original author(s) | Stefan Gerlach |
|---|---|
| Developer(s) | KDE |
| Initial release | 2001; 24 years ago (2001) (version 0.1, under the name QPlot) 2003; 22 years ago (2003) (version 1.0, renamed to LabPlot) |
| Stable release | 2.11.1 / 16 July 2024; 6 months ago (2024-07-16) |
| Repository | invent |
| Written in | C, C++ |
| Operating system | Microsoft Windows OS X Linux FreeBSD Haiku |
| Type | Scientific plotting Data analysis Curve fitting Regression analysis Statistical analysis Data processing Plot digitization Notebook interface Real-time data |
| License | GPL-2.0-or-later |
| Website | labplot |
LabPlot is a free and open-source, cross-platform computer program for interactive scientific plotting, curve fitting, nonlinear regression, data processing and data analysis. LabPlot is available, under the GPL-2.0-or-later license, for Windows, macOS, Linux, FreeBSD and Haiku operating systems.
It has a graphical user interface, a command-line interface and an interactive and animated notebook interface to mathematical and statistical packages and programming languages.
External links
See also
- List of statistical software
- List of information graphics software
- Comparison of numerical-analysis software
References
- "LabPlot 2.11.1 – LabPlot". 16 July 2024.
| KDE | |||||||||||||||||||
|---|---|---|---|---|---|---|---|---|---|---|---|---|---|---|---|---|---|---|---|
| Software compilation | [REDACTED] | ||||||||||||||||||
| Applications by KDE |
| ||||||||||||||||||
| Platform |
| ||||||||||||||||||
| Community | |||||||||||||||||||
| People | |||||||||||||||||||
| [REDACTED] | This KDE-related article is a stub. You can help Misplaced Pages by expanding it. |