| Revision as of 12:10, 30 May 2019 editYogeshpalDM (talk | contribs)30 editsm →External links← Previous edit | Revision as of 21:10, 31 May 2019 edit undoDeli nk (talk | contribs)Extended confirmed users78,799 edits Undid revision 899491332 by YogeshpalDM (talk)Tag: UndoNext edit → | ||
| Line 19: | Line 19: | ||
| * | * | ||
| * | * | ||
| * | |||
| ] | ] | ||
Revision as of 21:10, 31 May 2019

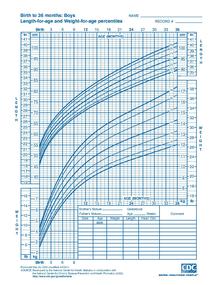
A growth chart is used by pediatricians and other health care providers to follow a child's growth over time. Growth charts have been constructed by observing the growth of large numbers of normal children over time. The height, weight, and head circumference of a child can be compared to the expected parameters of children of the same age and sex to determine whether the child is growing appropriately. Growth charts can also be used to predict the expected adult height and weight of a child because, in general, children maintain a fairly constant growth curve. When a child deviates from his or her previously established growth curve, investigation into the cause is generally warranted. For instance, a decrease in the growth velocity may indicate the onset of a chronic illness such as inflammatory bowel disease.

Growth charts can also be compiled with a portion of the population deemed to have been raised in more or less ideal environments, such as nutrition that conforms to pediatric guidelines, and no maternal smoking. Charts from these sources end up with slightly taller but thinner averages.
Growth charts are different for boys and girls, due in part to pubertal differences and disparity in final adult height. In addition, children with diseases such as Down syndrome and Turner syndrome follow distinct growth curves which deviate significantly from children without these conditions. As such, growth charts have been created to describe the expected growth patterns of several genetic conditions. Since there are differences in normal growth rates between breastfed and formula-fed babies, the World Health Organization growth charts, which better reflect the growth pattern of the healthy, breastfed infant are considered the standard for U.S. children under age two.
See also
- Failure to thrive, a growth disorder
- Weight and height percentile
References
- "WHO Child Growth Standards" (PDF). World Health Organization.
- Dewey, KG; Peerson, JM; Brown, KH; Krebs, NF; Michaelsen, KF; Persson, LA; Salmenpera, L; Whitehead, RG; Yeung, DL (1995). "Growth of breast-fed infants deviates from current reference data: A pooled analysis of US, Canadian, and European data sets. World Health Organization Working Group on Infant Growth". Pediatrics. 96 (3 Pt 1): 495–503. PMID 7651784.
- "Use of World Health Organization and CDC Growth Charts for Children Aged 0–59 Months in the United States" (PDF). Centers for Disease Control.
External links
- CDC information on growth charts
- WHO information on growth charts
- The WHO Child Growth Standards
- Growth Charts and Breastfeeding Babies