This is an old revision of this page, as edited by Justnoticedsomethingwrong (talk | contribs) at 00:38, 12 May 2022. The present address (URL) is a permanent link to this revision, which may differ significantly from the current revision.
Revision as of 00:38, 12 May 2022 by Justnoticedsomethingwrong (talk | contribs)(diff) ← Previous revision | Latest revision (diff) | Newer revision → (diff) Town in Connecticut, United States| Andover, Connecticut | |
|---|---|
| Town | |
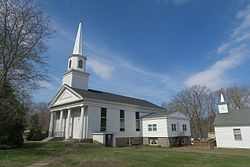
 First Congregational Church First Congregational Church | |
 Seal Seal | |
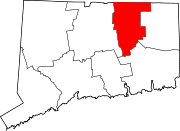
 Location in Tolland County and the state of Connecticut. Location in Tolland County and the state of Connecticut. | |
   | |
| Coordinates: 41°43′58″N 72°22′29″W / 41.73278°N 72.37472°W / 41.73278; -72.37472 | |
| Country | |
| U.S. state | |
| County | Tolland |
| Metropolitan area | Hartford |
| Government | |
| • Type | Selectman-town meeting |
| • First Selectman | Jeffrey J. Maguire (D) |
| • Selectmen | Adrian Mandeville (R) Jeffrey A. Murray (R) Scott R. Peterson (D) Paula King (R) |
| Area | |
| • Total | 15.7 sq mi (40.7 km) |
| • Land | 15.5 sq mi (40.0 km) |
| • Water | 0.2 sq mi (0.6 km) |
| Elevation | 400 ft (122 m) |
| Population | |
| • Total | 3,151 |
| Time zone | UTC−5 (Eastern) |
| • Summer (DST) | UTC−4 (Eastern) |
| ZIP code | 06232 |
| Area code | 860 |
| FIPS code | 09-01080 |
| GNIS feature ID | 213382 |
| Website | andoverconnecticut.org |
Andover is a rural town in Tolland County, Connecticut, United States. The population was 3,151 at the 2020 census. Andover is home to Andover Elementary School for grades K–6 while grades 7–12 go to R.H.A.M. middle and high schools. Andover elementary scores above average on standardized testing and student development as well as having a notably low student to teacher ratio of 8:1.
History
Andover was incorporated on May 18, 1848, from Hebron and Coventry. The name is a transfer from Andover, Hampshire, England.
Geography
According to the United States Census Bureau, the town has a total area of 15.7 square miles (41 km), of which, 15.5 square miles (40 km) of it is land and 0.2 square miles (0.52 km) of it (1.53%) is water. Most of the water of that is Andover Lake.
Demographics
| Census | Pop. | Note | %± |
|---|---|---|---|
| 1850 | 500 | — | |
| 1860 | 517 | 3.4% | |
| 1870 | 461 | −10.8% | |
| 1880 | 428 | −7.2% | |
| 1890 | 401 | −6.3% | |
| 1900 | 385 | −4.0% | |
| 1910 | 371 | −3.6% | |
| 1920 | 389 | 4.9% | |
| 1930 | 430 | 10.5% | |
| 1940 | 560 | 30.2% | |
| 1950 | 1,034 | 84.6% | |
| 1960 | 1,771 | 71.3% | |
| 1970 | 2,099 | 18.5% | |
| 1980 | 2,144 | 2.1% | |
| 1990 | 2,540 | 18.5% | |
| 2000 | 3,036 | 19.5% | |
| 2010 | 3,303 | 8.8% | |
| 2020 | 3,151 | −4.6% | |
| U.S. Decennial Census | |||
As of the 2010 United States Census Andover had a population of 3,304. The racial composition of the population was 95.9% white, 1.1% black or African American, 0.1% Native American, 1.1% Asian, 0.5% from some other race and 1.2% reporting two or more race. 1.6% of the population was Hispanic or Latino of any race.
At the 2000 census there were 3,036 people, 1,150 households, and 861 families living in the town. The population density was 196.4 people per square mile (75.8/km). There were 1,198 housing units at an average density of 77.5 per square mile (29.9/km). The racial makeup of the town was 96.64% White, 0.92% African American, 0.33% Native American, 0.46% Asian, 0.69% from other races, and 0.96% from two or more races. Hispanic or Latino of any race were 1.55%.
Of the 1,150 households 37.5% had children under the age of 18 living with them, 64.3% were married couples living together, 8.0% had a female householder with no husband present, and 25.1% were non-families. 19.0% of households were one person and 5.6% were one person aged 65 or older. The average household size was 2.64 and the average family size was 3.04.
The age distribution was 27.3% under the age of 18, 4.3% from 18 to 24, 34.9% from 25 to 44, 25.7% from 45 to 64, and 7.7% 65 or older. The median age was 38 years. For every 100 females, there were 102.1 males. For every 100 females age 18 and over, there were 98.2 males.
The median household income was $92,822, and the median family income was $45,234. Males had a median income of $21,543 versus $18,167 for females. The per capita income for the town was $30,273. About 2.3% of families and 3.6% of the population were below the poverty line, including 2.8% of those under age 18 and 4.8% of those age 65 or over.
Points of interest
- Andover Veterans Monument Park is located on Monument Lane in front of the Museum of Andover History. The Agent Orange Monument in memory of those who died because of Agent Orange during the Vietnam war was unveiled on June 5, 2021 at the Andover Veterans Monument Park.
- Museum of Andover History is located in the Old Town Hall on Monument Lane. It traces the history of Andover since 1600.
Politics
Voter registration
| Voter Registration and Party Enrollment as of October 29, 2019 | |||||
|---|---|---|---|---|---|
| Party | Active Voters | Inactive Voters | Total Voters | Percentage | |
| Democratic | 697 | 0 | 697 | 31.87% | |
| Republican | 614 | 0 | 614 | 28.07% | |
| Unaffiliated | 836 | 1 | 837 | 38.27% | |
| Minor Parties | 39 | 0 | 39 | 1.78% | |
| Total | 2,186 | 1 | 2,187 | 100% | |
Election results
| Presidential Election Results | |||
|---|---|---|---|
| Year | Democratic | Republican | Third Parties |
| 2020 | 50.6% 1,058 | 47.7% 998 | 1.7% 35 |
| 2016 | 47.0% 896 | 46.7% 891 | 6.3% 121 |
| 2012 | 55.1% 976 | 43.7% 774 | 1.2% 22 |
| 2008 | 58.4% 1,090 | 39.9% 745 | 1.7% 31 |
| 2004 | 54.4% 980 | 44.1% 796 | 1.5% 28 |
| 2000 | 54.9% 871 | 38.2% 609 | 6.9% 111 |
| 1996 | 48.5% 711 | 32.7% 480 | 18.8% 275 |
| 1992 | 40.0% 634 | 30.2% 480 | 29.8% 472 |
| 1988 | 47.5% 604 | 50.9% 649 | 1.6% 21 |
| 1984 | 36.5% 435 | 63.5% 758 | 0.00% 0 |
| 1980 | 32.5% 374 | 47.9% 552 | 19.6% 226 |
| 1976 | 47.8% 487 | 51.6% 526 | 0.6% 6 |
| 1972 | 41.3% 446 | 57.7% 624 | 1.0% 11 |
| 1968 | 44.0% 419 | 49.1% 469 | 6.9% 66 |
| 1964 | 52.3% 556 | 47.7% 508 | 0.00% 0 |
| 1960 | 46.6% 391 | 56.4% 505 | 0.00% 0 |
| 1956 | 32.7% 240 | 67.3% 494 | 0.00% 0 |
References
- U.S. Census Bureau Population Estimates
- "Census - Geography Profile: Andover town, Tolland County, Connecticut". Retrieved November 25, 2021.
- Link text
- The Connecticut Magazine: An Illustrated Monthly. Connecticut Magazine Company. 1903. p. 330.
- "Census of Population and Housing". Census.gov. Retrieved June 4, 2015.
- 2010 race and Hispanic or Latino by place chart for Connecticut from the US Census
- "U.S. Census website". United States Census Bureau. Retrieved 2008-01-31.
- "Andover, Connecticut (CT 06232) profile: population, maps, real estate, averages, homes, statistics, relocation, travel, jobs, hospitals, schools, crime, moving, houses, news, sex offenders". www.city-data.com. Retrieved 2018-03-20.
- Rodriguez Jr., Ismael. "'We've Been Fighting This for 55 Years'", VFW Magazine, volume 109, number 2, October 2021, pages 42-43.
- "Registration and Party Enrollment Statistics as of October 29, 2019" (PDF). Connecticut Secretary of State. Retrieved 2020-02-17.
- "General Election Statements of Vote, 1922 – Current". CT Secretary of State. Retrieved May 8, 2020.
- "Election Night Reporting". CT Secretary of State. Retrieved December 14, 2020.
External links
| Municipalities and communities of Tolland County, Connecticut, United States | ||
|---|---|---|
| County seat: Rockville | ||
| Towns |  | |
| CDPs | ||
| Other communities | ||
| Greater Hartford | |
|---|---|
| Counties | |
| Cities 100k-250k | |
| Cities and towns 50k-100k | |
| Cities and towns 10k-50k |
|
| Towns ≤10k | |
| Related articles | |