This is an old revision of this page, as edited by TheTechnician27 (talk | contribs) at 19:05, 14 August 2024 (Removed the COI tag, as the COI seems to have been thoroughly stripped out at this point.). The present address (URL) is a permanent link to this revision, which may differ significantly from the current revision.
Revision as of 19:05, 14 August 2024 by TheTechnician27 (talk | contribs) (Removed the COI tag, as the COI seems to have been thoroughly stripped out at this point.)(diff) ← Previous revision | Latest revision (diff) | Newer revision → (diff) Application for interactive graphing and analysis of scientific data| The topic of this article may not meet Misplaced Pages's general notability guideline. Please help to demonstrate the notability of the topic by citing reliable secondary sources that are independent of the topic and provide significant coverage of it beyond a mere trivial mention. If notability cannot be shown, the article is likely to be merged, redirected, or deleted. Find sources: "LabPlot" – news · newspapers · books · scholar · JSTOR (July 2024) (Learn how and when to remove this message) |
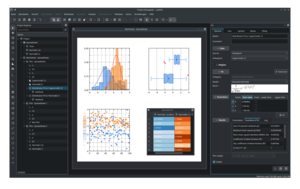
 Screenshot of LabPlot of 2022 Screenshot of LabPlot of 2022 | |
| Original author(s) | Stefan Gerlach |
|---|---|
| Developer(s) | KDE |
| Initial release | 2001; 24 years ago (2001) (version 0.1, under the name QPlot) 2003; 22 years ago (2003) (version 1.0, renamed to LabPlot) |
| Stable release | 2.11.1 / 16 July 2024; 5 months ago (2024-07-16) |
| Repository | invent |
| Written in | C, C++ |
| Operating system | Microsoft Windows OS X Linux FreeBSD Haiku |
| Type | Scientific plotting Data analysis Curve fitting Regression analysis Statistical analysis Data processing Plot digitization Notebook interface Real-time data |
| License | GPL-2.0-or-later |
| Website | labplot |
LabPlot is a free and open-source, cross-platform computer program for interactive scientific plotting, curve fitting, nonlinear regression, data processing and data analysis. LabPlot is available, under the GPL-2.0-or-later license, for Windows, macOS, Linux, FreeBSD and Haiku operating systems.
It has a graphical user interface, a command-line interface and an interactive and animated notebook interface to mathematical and statistical packages and programming languages.
External links
See also
- List of statistical software
- List of information graphics software
- Comparison of numerical-analysis software
References
- "LabPlot 2.11.1 – LabPlot". 16 July 2024.
| KDE | |||||||||||||||||||
|---|---|---|---|---|---|---|---|---|---|---|---|---|---|---|---|---|---|---|---|
| Software compilation |  | ||||||||||||||||||
| Applications by KDE |
| ||||||||||||||||||
| Platform |
| ||||||||||||||||||
| Community | |||||||||||||||||||
| People | |||||||||||||||||||
This KDE-related article is a stub. You can help Misplaced Pages by expanding it. |