This is an old revision of this page, as edited by ColRad85 (talk | contribs) at 23:55, 26 September 2024 (Disambiguating links to QT (link changed to Qt (software)) using DisamAssist.). The present address (URL) is a permanent link to this revision, which may differ significantly from the current revision.
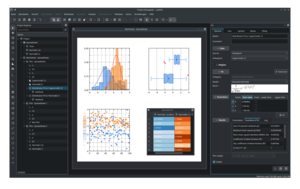
Revision as of 23:55, 26 September 2024 by ColRad85 (talk | contribs) (Disambiguating links to QT (link changed to Qt (software)) using DisamAssist.)(diff) ← Previous revision | Latest revision (diff) | Newer revision → (diff) Application for interactive graphing and analysis of scientific data Screenshot of LabPlot of 2022 Screenshot of LabPlot of 2022 | |
| Original author(s) | Stefan Gerlach |
|---|---|
| Developer(s) | KDE |
| Initial release | 2001; 24 years ago (2001) (version 0.1, under the name QPlot) 2003; 22 years ago (2003) (version 1.0, renamed to LabPlot) |
| Stable release | 2.11.1 / 16 July 2024; 5 months ago (2024-07-16) |
| Repository | invent |
| Written in | C, C++ |
| Operating system | Microsoft Windows OS X Linux FreeBSD Haiku |
| Type | Scientific plotting Data analysis Curve fitting Regression analysis Statistical analysis Data processing Plot digitization Notebook interface Real-time data |
| License | GPL-2.0-or-later |
| Website | labplot |
LabPlot is a free and open-source, cross-platform computer program for interactive scientific plotting, curve fitting, nonlinear regression, data processing and data analysis. LabPlot is available, under the GPL-2.0-or-later license, for Windows, macOS, Linux, FreeBSD and Haiku operating systems.
It has a graphical user interface, a command-line interface, and an interactive and animated notebook interface. It is similar to Origin and able to import Origin's data files. Features include the Hilbert transform function, statistics, color maps, conditional formatting, and multi-axes.
History
In 2008, developers of LabPlot and SciDAVis (another Origin clone, forked from QtiPlot) "found their project goals to be very similar" and decided to merge their code into a common backend while maintaining two frontends: LabPlot, integrated with the KDE desktop environment (DE); and SciDAVis, written in DE-independent Qt with fewer dependencies for easier cross-platform use.
Starting April 2024, LabPlot received funding from NLnet's NGI0 Core grant to add scripting capabilities (via Python and a public interface), more data analysis functions, and statistical analysis features.
See also
- List of statistical software
- List of information graphics software
- Comparison of numerical-analysis software
References
- "LabPlot 2.11.1 – LabPlot". 16 July 2024.
- Косуліна, Н.Г.; Сухін, В.В.; Чорна, М.О.; Ляшенко, Г.А.; Коршунов, К.С. (December 2023), "Програмне Забезпечення Обов'язкових Та Вибіркових Освітніх Компонентів Освітньої Програми «біомедична Інженерія»" [Software of mandatory and optional educational components Educational program “Biomedical Engineering”] (PDF), Sciences of Europe (in Ukrainian), no. 131, Prague, Czech Republic, p. 77
- Carmona, Marco (2021-11-08), "7 Free and Open Source Plotting Tools [For Maths and Stats]", It’s FOSS, retrieved 2024-08-22
- LabPlot and SciDAVis Collaborate on the Future of Free Scientific Plotting, 16 October 2009
- "LabPlot", Projects, NLnet Foundation, retrieved 2024-08-22
External links
| KDE | |||||||||||||||||||
|---|---|---|---|---|---|---|---|---|---|---|---|---|---|---|---|---|---|---|---|
| Software compilation |  | ||||||||||||||||||
| Applications by KDE |
| ||||||||||||||||||
| Platform |
| ||||||||||||||||||
| Community | |||||||||||||||||||
| People | |||||||||||||||||||
This KDE-related article is a stub. You can help Misplaced Pages by expanding it. |