Main article: 1888 United States presidential election
| ||||||||||||||||||||||||||
| ||||||||||||||||||||||||||
 County Results County Results
| ||||||||||||||||||||||||||
| ||||||||||||||||||||||||||
The 1888 United States presidential election in Maryland took place on November 6, 1888, as part of the 1888 United States presidential election. Voters chose eight representatives, or electors to the Electoral College, who voted for president and vice president.
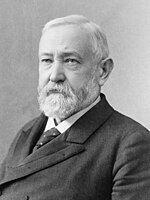
Maryland voted for the Democratic nominee, incumbent President Grover Cleveland, over the Republican nominee, Benjamin Harrison. Cleveland won the state by a narrow margin of 2.94%. Despite the narrow margin, Maryland was still 2.11% more Democratic than the nation at large.
Results
| 1888 United States presidential election in Maryland | ||||||||
|---|---|---|---|---|---|---|---|---|
| Party | Candidate | Running mate | Popular vote | Electoral vote | ||||
| Count | % | Count | % | |||||
| Democratic | Grover Cleveland of New York (incumbent) | Allen Granberry Thurman of Ohio | 106,188 | 50.34% | 8 | 100.00% | ||
| Republican | Benjamin Harrison of Indiana | Levi Parsons Morton of New York | 99,986 | 47.40% | 0 | 0.00% | ||
| Prohibition | Clinton Bowen Fisk of New Jersey | John Anderson Brooks of Missouri | 4,767 | 2.26% | 0 | 0.00% | ||
| Total | 210,941 | 100.00% | 8 | 100.00% | ||||
Results by county
| County | Grover Cleveland
Democratic |
Benjamin Harrison
Republican |
Clinton Bowen Fisk
Prohibition |
Margin | Total
Votes Cast | ||||
|---|---|---|---|---|---|---|---|---|---|
| # | % | # | % | # | % | # | % | ||
| Allegany | 3,299 | 43.76% | 4,072 | 54.02% | 167 | 2.22% | -773 | -10.26% | 7,538 |
| Anne Arundel | 2,979 | 48.96% | 2,992 | 49.17% | 114 | 1.87% | -13 | -0.21% | 6,085 |
| Baltimore (City) | 44,604 | 52.22% | 39,559 | 46.31% | 1,252 | 1.47% | 5,045 | 5.91% | 85,415 |
| Baltimore (County) | 6,464 | 53.28% | 5,224 | 43.06% | 443 | 3.65% | 1240 | 10.22% | 12,131 |
| Calvert | 933 | 43.42% | 1,163 | 54.12% | 53 | 2.47% | -230 | -10.70% | 2,149 |
| Caroline | 1,420 | 46.97% | 1,490 | 49.29% | 113 | 3.74% | -70 | -2.32% | 3,023 |
| Carroll | 3,772 | 49.53% | 3,674 | 48.24% | 170 | 2.23% | 98 | 1.29% | 7,616 |
| Cecil | 2,970 | 50.01% | 2,879 | 48.48% | 90 | 2.23% | 91 | 1.53% | 5,939 |
| Charles | 1,430 | 49.77% | 1,431 | 49.81% | 12 | 1.52% | -1 | -0.04% | 2,873 |
| Dorchester | 2,114 | 43.58% | 2,602 | 53.64% | 135 | 2.78% | -488 | -10.06% | 4,851 |
| Frederick | 5,385 | 47.07% | 5,822 | 50.89% | 233 | 2.04% | -437 | -3.82% | 11,440 |
| Garrett | 1,239 | 44.38% | 1,533 | 54.91% | 20 | 0.72% | -294 | -10.53% | 2,792 |
| Harford | 3,408 | 53.14% | 2,830 | 44.13% | 175 | 2.73% | 578 | 9.01% | 6,413 |
| Howard | 1,774 | 52.80% | 1,521 | 45.27% | 65 | 1.93% | 253 | 7.53% | 3,360 |
| Kent | 2,062 | 49.24% | 2,037 | 48.64% | 89 | 2.13% | 25 | 0.60% | 4,188 |
| Montgomery | 3,272 | 53.41% | 2,712 | 44.27% | 142 | 2.32% | 560 | 9.14% | 6,126 |
| Prince George's | 3,081 | 50.33% | 3,019 | 49.32% | 21 | 0.34% | 62 | 1.01% | 6,121 |
| Queen Anne's | 2,286 | 54.47% | 1,738 | 41.41% | 173 | 4.12% | 548 | 13.06% | 4,197 |
| St. Mary's | 1,551 | 46.20% | 1,772 | 52.79% | 173 | 1.01% | -221 | -6.59% | 3,357 |
| Somerset | 1,625 | 39.92% | 2,072 | 50.90% | 374 | 9.19% | -447 | -10.98% | 4,071 |
| Talbot | 2,120 | 47.01% | 2,282 | 50.60% | 108 | 2.39% | -162 | -3.59% | 4,510 |
| Washington | 4,254 | 46.71% | 4,648 | 51.04% | 205 | 2.25% | -394 | -4.33% | 9,107 |
| Wicomico | 2,210 | 56.86% | 1,441 | 37.07% | 236 | 6.07% | 769 | 19.79% | 3,887 |
| Worcester | 1,916 | 51.34% | 1,473 | 39.47% | 343 | 9.19% | 443 | 11.87% | 3,732 |
| Total | 106,188 | 50.34% | 99,986 | 47.40% | 4,767 | 2.26% | 6,202 | 2.94% | 210,941 |
Counties that flipped from Democratic to Republican
See also
- United States presidential elections in Maryland
- 1888 United States presidential election
- 1888 United States elections
References
- "Dave Leip's Atlas of U.S. Presidential Elections". uselectionatlas.org. Retrieved March 31, 2023.
- "1888 Presidential General Election Results - Maryland". U.S. Election Atlas. Retrieved December 23, 2013.
- "County Project (WIP)". Google Docs. Retrieved November 1, 2022.
| State and district results of the 1888 United States presidential election | ||
|---|---|---|
|  | |
| (← 1884) 1888 United States presidential election (1892 →) | |||||||||||||
|---|---|---|---|---|---|---|---|---|---|---|---|---|---|
| Republican Party (Convention) |
| ||||||||||||
| Democratic Party (Convention) |
| ||||||||||||
| |||||||||||||
| General | |
|---|---|
| Governor |
|
| State Senate | |
| House of Delegates | |
| U.S. President | |
| U.S. Senate |
|
| U.S. House |
|
| Attorney General | |
| Comptroller | |
| County Executive | |
| County offices | |
| See also: Political party strength in Maryland | |


