Main article: 1960 United States presidential election
1960 United States presidential election in Colorado
Nixon
50–60%
60–70%
Kennedy
40–50%
50–60%
60–70%
The 1960 United States presidential election in Colorado took place on November 8, 1960, as part of the 1960 United States presidential election . State voters chose six representatives, or electors, to the Electoral College , who voted for president and vice president .
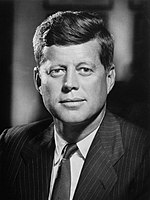
Colorado was won by incumbent Vice President Richard Nixon (R –California ), running with United States Ambassador to the United Nations Henry Cabot Lodge Jr. , with 54.63% of the popular vote, against Senator John F. Kennedy (D –Massachusetts ), running with Senator Lyndon B. Johnson , with 44.91% of the popular vote.
Results
Results by county
County
Richard Nixon
John F. Kennedy
Eric Hass
Farrell Dobbs
Margin
Total votes cast
#
%
#
%
#
%
#
%
#
%
Adams
18,452
46.36%
21,168
53.19%
164
0.41%
14
0.04%
-2,716
-6.83%
39,798
Alamosa
2,271
55.58%
1,811
44.32%
3
0.07%
1
0.02%
460
11.26%
4,086
Arapahoe
26,379
60.07%
17,400
39.62%
109
0.25%
28
0.06%
8,979
20.45%
43,916
Archuleta
489
46.26%
567
53.64%
1
0.09%
0
0.00%
-78
-7.38%
1,057
Baca
1,815
65.48%
952
34.34%
2
0.07%
3
0.11%
863
31.14%
2,772
Bent
1,671
57.54%
1,228
42.29%
4
0.14%
1
0.03%
443
15.25%
2,904
Boulder
19,791
61.47%
12,276
38.13%
105
0.33%
25
0.08%
7,515
23.34%
32,197
Chaffee
2,094
52.14%
1,918
47.76%
3
0.07%
1
0.02%
176
4.38%
4,016
Cheyenne
806
65.69%
419
34.15%
2
0.16%
0
0.00%
387
31.54%
1,227
Clear Creek
964
58.35%
688
41.65%
0
0.00%
0
0.00%
276
16.70%
1,652
Conejos
1,367
38.80%
2,069
58.73%
42
1.19%
45
1.28%
-702
-19.93%
3,523
Costilla
637
31.83%
1,351
67.52%
10
0.50%
3
0.15%
-714
-35.69%
2,001
Crowley
1,099
60.89%
705
39.06%
1
0.06%
0
0.00%
394
21.83%
1,805
Custer
509
61.85%
314
38.15%
0
0.00%
0
0.00%
195
23.70%
823
Delta
4,644
63.24%
2,689
36.62%
6
0.08%
4
0.05%
1,955
26.62%
7,343
Denver
109,446
49.59%
109,637
49.68%
1,429
0.65%
189
0.09%
-191
-0.09%
220,701
Dolores
476
55.22%
386
44.78%
0
0.00%
0
0.00%
90
10.44%
862
Douglas
1,490
64.42%
823
35.58%
0
0.00%
0
0.00%
667
28.84%
2,313
Eagle
989
52.86%
880
47.03%
2
0.11%
0
0.00%
109
5.83%
1,871
El Paso
31,625
64.93%
17,018
34.94%
40
0.08%
21
0.04%
14,607
29.99%
48,704
Elbert
1,240
64.32%
686
35.58%
2
0.10%
0
0.00%
554
28.74%
1,928
Fremont
5,690
60.19%
3,730
39.45%
13
0.14%
21
0.22%
1,960
20.74%
9,454
Garfield
3,215
58.04%
2,313
41.76%
9
0.16%
2
0.04%
902
16.28%
5,539
Gilpin
315
58.55%
223
41.45%
0
0.00%
0
0.00%
92
17.10%
538
Grand
1,104
62.62%
657
37.27%
1
0.06%
1
0.06%
447
25.35%
1,763
Gunnison
1,296
55.31%
1,044
44.56%
1
0.04%
2
0.09%
252
10.75%
2,343
Hinsdale
138
62.73%
82
37.27%
0
0.00%
0
0.00%
56
25.46%
220
Huerfano
1,367
33.73%
2,673
65.95%
8
0.20%
5
0.12%
-1,306
-32.22%
4,053
Jackson
504
58.27%
360
41.62%
1
0.12%
0
0.00%
144
16.65%
865
Jefferson
34,105
59.62%
22,962
40.14%
107
0.19%
30
0.05%
11,143
19.48%
57,204
Kiowa
865
63.42%
498
36.51%
1
0.07%
0
0.00%
367
26.91%
1,364
Kit Carson
2,248
66.88%
1,103
32.82%
2
0.06%
8
0.24%
1,145
34.06%
3,361
La Plata
4,772
58.83%
3,329
41.04%
6
0.07%
4
0.05%
1,443
17.79%
8,111
Lake
954
34.03%
1,842
65.72%
2
0.07%
5
0.18%
-888
-31.69%
2,803
Larimer
15,671
67.39%
7,550
32.47%
23
0.10%
11
0.05%
8,121
34.92%
23,255
Las Animas
2,989
30.74%
6,704
68.96%
15
0.15%
14
0.14%
-3,715
-38.22%
9,722
Lincoln
1,498
58.93%
1,041
40.95%
3
0.12%
0
0.00%
457
17.98%
2,542
Logan
5,002
59.97%
3,334
39.97%
1
0.01%
4
0.05%
1,668
20.00%
8,341
Mesa
13,015
58.81%
9,072
40.99%
32
0.14%
13
0.06%
3,943
17.82%
22,132
Mineral
146
47.87%
158
51.80%
1
0.33%
0
0.00%
-12
-3.93%
305
Moffat
1,754
59.32%
1,200
40.58%
2
0.07%
1
0.03%
554
18.74%
2,343
Montezuma
2,778
56.69%
2,115
43.16%
5
0.10%
2
0.04%
663
13.53%
4,900
Montrose
4,040
58.34%
2,861
41.31%
17
0.25%
7
0.10%
1,179
17.03%
6,925
Morgan
5,092
61.65%
3,151
38.15%
11
0.13%
5
0.06%
1,941
23.50%
8,259
Otero
6,015
58.80%
4,199
41.05%
7
0.07%
8
0.08%
1,816
17.75%
10,229
Ouray
508
54.04%
432
45.96%
0
0.00%
0
0.00%
76
8.08%
940
Park
642
59.33%
438
40.48%
2
0.18%
0
0.00%
204
18.85%
1,082
Phillips
1,455
62.77%
862
37.19%
1
0.04%
0
0.00%
593
25.58%
2,318
Pitkin
679
58.18%
488
41.82%
0
0.00%
0
0.00%
191
16.36%
1,167
Prowers
3,567
59.15%
2,457
40.75%
3
0.05%
3
0.05%
1,110
18.40%
6,030
Pueblo
20,579
42.36%
27,421
56.44%
541
1.11%
41
0.08%
-6,842
-14.08%
48,582
Rio Blanco
1,391
63.57%
794
36.29%
2
0.09%
1
0.05%
597
27.28%
2,188
Rio Grande
2,524
58.53%
1,782
41.33%
5
0.12%
1
0.02%
742
17.20%
4,312
Routt
1,651
53.83%
1,414
46.10%
1
0.03%
1
0.03%
237
7.73%
3,067
Saguache
956
49.05%
984
50.49%
6
0.31%
3
0.15%
-28
-1.44%
1,949
San Juan
218
45.23%
261
54.15%
3
0.62%
0
0.00%
-43
-8.92%
482
San Miguel
525
46.09%
612
53.73%
2
0.18%
0
0.00%
-87
-7.64%
1,139
Sedgwick
1,230
61.41%
769
38.39%
3
0.15%
1
0.05%
461
23.02%
2,003
Summit
424
51.27%
400
48.37%
3
0.36%
0
0.00%
24
2.90%
827
Teller
723
53.60%
622
46.11%
3
0.22%
1
0.07%
101
7.49%
1,349
Washington
1,979
65.49%
1,039
34.38%
3
0.01%
1
0.03%
940
31.11%
3,022
Weld
17,558
60.99%
11,179
38.83%
30
0.10%
23
0.08%
6,379
22.16%
28,790
Yuma
2,806
65.18%
1,489
34.59%
5
0.12%
5
0.12%
1,317
30.59%
4,305
Total
402,242
54.63%
330,629
44.91%
2,803
0.38%
572
0.08%
71,613
9.72%
736,246
Counties that flipped from Republican to Democratic
References
"United States Presidential election of 1960 - Encyclopædia Britannica" . Retrieved June 6, 2017."1960 Election for the Forty-Fourth Term (1961-65)" . Retrieved June 6, 2017."1960 Presidential General Election Results - Colorado" . Retrieved June 6, 2017."The American Presidency Project - Election of 1960" . Retrieved June 6, 2017."1960 Nov 8 :: General Election :: President :: State of Colorado" . Colorado Secretary of State . Retrieved November 30, 2024.
Categories :
Text is available under the Creative Commons Attribution-ShareAlike License. Additional terms may apply.
**DISCLAIMER** We are not affiliated with Wikipedia, and Cloudflare.
The information presented on this site is for general informational purposes only and does not constitute medical advice.
You should always have a personal consultation with a healthcare professional before making changes to your diet, medication, or exercise routine.
AI helps with the correspondence in our chat.
We participate in an affiliate program. If you buy something through a link, we may earn a commission 💕
↑
 County Results


