(Redirected from 1971 Danish parliamentary election )
1971 Danish general election Folketing Turnout 87.16%
This lists parties that won seats. See the complete results below.
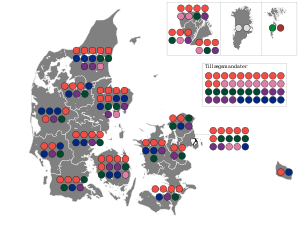
General elections were held in Denmark on 21 September 1971 and in the Faroe Islands on 5 October. The Social Democratic Party remained the largest in the Folketing , with 70 of the 179 seats. Voter turnout was 87% in Denmark proper, 57% in the Faroe Islands and 52% in Greenland (where only one of the two constituencies was contested as the other had only a single candidate who was elected unopposed).
Electoral system
All members were elected by party-list proportional representation in multi-member constituencies and in levelling seats filled at-large using overall party vote shares. The districts elected between 2 and 14 members each. They were the first elections using the new counties as constituencies.
Results
Party Votes % Seats +/– Denmark proper Social Democrats 1,074,777 37.27 70 +8 Conservative People's Party 481,335 16.69 31 –6 Venstre 450,904 15.64 30 –4 Danish Social Liberal Party 413,620 14.34 27 0 Socialist People's Party 262,756 9.11 17 +6 Christian People's Party 57,072 1.98 0 New Justice Party of Denmark 50,231 1.74 0 0 Left Socialists 45,979 1.59 0 –4 Communist Party of Denmark 39,564 1.37 0 0 Schleswig Party 6,743 0.23 0 0 Independents 919 0.03 0 0 Total 2,883,900 100.00 175 0 Valid votes 2,883,900 99.30 Invalid/blank votes 20,196 0.70 Total votes 2,904,096 100.00 Registered voters/turnout 3,332,004 87.16 Faroe Islands Social Democratic Party 4,170 31.77 1 0 Union Party 2,855 21.75 0 0 People's Party 2,680 20.42 1 0 Self-Government 648 4.94 0 New Progress Party 362 2.76 0 0 Independents 2,410 18.36 0 New Total 13,125 100.00 2 0 Valid votes 13,125 99.42 Invalid/blank votes 77 0.58 Total votes 13,202 100.00 Registered voters/turnout 23,260 56.76 Greenland Independents 7,148 100.00 2 0 Total 7,148 100.00 2 0 Valid votes 7,148 97.34 Invalid/blank votes 195 2.66 Total votes 7,343 100.00 Registered voters/turnout 14,104 52.06 Source: Nohlen & Stöver, Danmarks Statistik
References
Dieter Nohlen & Philip Stöver (2010) Elections in Europe: A data handbook , p524 ISBN 978-3-8329-5609-7
Denmark Inter-Parliamentary Union
Categories :
Text is available under the Creative Commons Attribution-ShareAlike License. Additional terms may apply.
**DISCLAIMER** We are not affiliated with Wikipedia, and Cloudflare.
The information presented on this site is for general informational purposes only and does not constitute medical advice.
You should always have a personal consultation with a healthcare professional before making changes to your diet, medication, or exercise routine.
AI helps with the correspondence in our chat.
We participate in an affiliate program. If you buy something through a link, we may earn a commission 💕
↑


