| ||||||||||||||||||||||||||||||||||||||||||||||||||||||||||||||||||||||||||||||||||||||||||||||||||||||
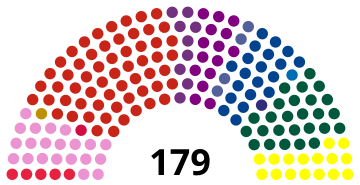
All 179 seats in the Folketing 90 seats needed for a majority | ||||||||||||||||||||||||||||||||||||||||||||||||||||||||||||||||||||||||||||||||||||||||||||||||||||||
| Turnout | 83.26% | |||||||||||||||||||||||||||||||||||||||||||||||||||||||||||||||||||||||||||||||||||||||||||||||||||||
|---|---|---|---|---|---|---|---|---|---|---|---|---|---|---|---|---|---|---|---|---|---|---|---|---|---|---|---|---|---|---|---|---|---|---|---|---|---|---|---|---|---|---|---|---|---|---|---|---|---|---|---|---|---|---|---|---|---|---|---|---|---|---|---|---|---|---|---|---|---|---|---|---|---|---|---|---|---|---|---|---|---|---|---|---|---|---|---|---|---|---|---|---|---|---|---|---|---|---|---|---|---|---|
| ||||||||||||||||||||||||||||||||||||||||||||||||||||||||||||||||||||||||||||||||||||||||||||||||||||||
General elections were held in Denmark on 8 December 1981. The election was followed by a two-week crisis over the formation of a new government before the Social Democratic Party resumed its minority government.
The Social Democratic Party lost several seats but remained the largest party in the Folketing, with 59 of the 179 seats.
Voter turnout was 83% in Denmark proper, 55% in the Faroe Islands and 61% in Greenland.
Results
 | |||||
|---|---|---|---|---|---|
| Party | Votes | % | Seats | +/– | |
| Denmark proper | |||||
| Social Democrats | 1,026,726 | 32.87 | 59 | –9 | |
| Conservative People's Party | 451,478 | 14.45 | 26 | +4 | |
| Socialist People's Party | 353,373 | 11.31 | 21 | +10 | |
| Venstre | 353,280 | 11.31 | 20 | –2 | |
| Progress Party | 278,383 | 8.91 | 16 | –4 | |
| Centre Democrats | 258,522 | 8.28 | 15 | +9 | |
| Danish Social Liberal Party | 160,053 | 5.12 | 9 | –1 | |
| Left Socialists | 82,711 | 2.65 | 5 | –1 | |
| Christian People's Party | 72,174 | 2.31 | 4 | –1 | |
| Justice Party of Denmark | 45,174 | 1.45 | 0 | –5 | |
| Communist Party of Denmark | 34,625 | 1.11 | 0 | 0 | |
| Communist Workers Party | 4,223 | 0.14 | 0 | 0 | |
| Socialist Workers Party | 2,034 | 0.07 | 0 | New | |
| Independents | 807 | 0.03 | 0 | 0 | |
| Total | 3,123,563 | 100.00 | 175 | 0 | |
| Valid votes | 3,123,563 | 99.37 | |||
| Invalid/blank votes | 19,881 | 0.63 | |||
| Total votes | 3,143,444 | 100.00 | |||
| Registered voters/turnout | 3,775,333 | 83.26 | |||
| Faroe Islands | |||||
| Union Party | 4,393 | 26.44 | 1 | 0 | |
| Social Democratic Party | 4,070 | 24.49 | 1 | 0 | |
| Republican Party | 3,441 | 20.71 | 0 | 0 | |
| People's Party | 3,073 | 18.49 | 0 | 0 | |
| Self-Government | 867 | 5.22 | 0 | 0 | |
| Progress and Fisheries Party | 773 | 4.65 | 0 | 0 | |
| Total | 16,617 | 100.00 | 2 | 0 | |
| Valid votes | 16,617 | 99.53 | |||
| Invalid/blank votes | 79 | 0.47 | |||
| Total votes | 16,696 | 100.00 | |||
| Registered voters/turnout | 30,127 | 55.42 | |||
| Greenland | |||||
| Atassut | 9,223 | 48.86 | 1 | 0 | |
| Siumut | 7,126 | 37.75 | 1 | 0 | |
| Independents | 2,529 | 13.40 | 0 | New | |
| Total | 18,878 | 100.00 | 2 | 0 | |
| Valid votes | 18,878 | 95.33 | |||
| Invalid/blank votes | 925 | 4.67 | |||
| Total votes | 19,803 | 100.00 | |||
| Registered voters/turnout | 32,466 | 61.00 | |||
| Source: Nohlen & Stöver | |||||
References
- Dieter Nohlen & Philip Stöver (2010) Elections in Europe: A data handbook, p525 ISBN 978-3-8329-5609-7
- Borre, Ole (1982). "The Danish parliamentary election of 1981". Electoral Studies. 1 (2): 250–254. doi:10.1016/0261-3794(82)90007-5. ISSN 0261-3794.
- Nohlen & Stöver, p545


