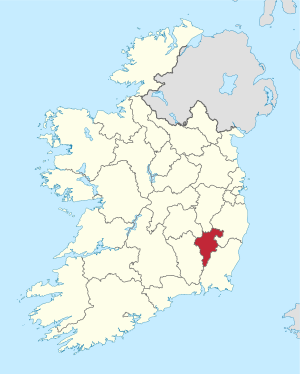
Part of the 1991 Irish local elections
1991 Carlow County Council election Carlow County Council
Council control before election Fine Gael/Labour
Council control after election Fine Gael/Labour
An election to Carlow County Council took place on 27 June 1991 as part of that year's Irish local elections . 21 councillors were elected from four local electoral areas (LEAs) for a five-year term of office on the electoral system of proportional representation by means of the single transferable vote (PR-STV). This term was extended twice, first to 1998, then to 1999.
Results by party
Results by local electoral area
Borris
Borris - 4 seats
Party
Candidate
FPv% Count
1
2
3
4
Labour
Michael Meaney *
29.2%
1,020
Fianna Fáil
Mary Kinsella *
16.4%
575
636
741
Fianna Fáil
Brendan Walsh
15.5%
543
603
655
667
Fine Gael
Michael Doyle *
14.2%
498
577
596
808
Fianna Fáil
Liam Murphy*
9.1%
317
361
446
493
Fine Gael
Ciaran Redmond
7.9%
278
313
331
Fianna Fáil
David Moore
7.6%
267
308
Electorate: 5,866 Valid: 3,498 (59.63%) Spoilt: 36 Quota: 700 Turnout: 3,534 (60.25%)
Carlow
Carlow - 7 seats
Party
Candidate
FPv% Count
1
2
3
4
5
6
7
8
9
10
11
Fine Gael
John Browne TD14.5%
756
Fianna Fáil
Patrick Carpenter *
10.7%
560
575
588
648
673
Labour
Des Hurley
10.7%
557
558
563
592
707
Fianna Fáil
Jimmy Murnane *
10.4%
545
551
554
566
576
580
582
614
635
649
664
Progressive Democrats
Walter Lacey
8.3%
436
439
451
475
499
513
516
542
595
696
Fine Gael
Declan Alcock
7.9%
413
414
428
440
450
460
462
486
570
739
Fianna Fáil
M.J. Nolan TD7.3%
379
389
395
406
413
414
416
489
524
563
578
Fianna Fáil
Rody Kelly
6%
314
325
332
344
362
363
364
428
444
474
495
Fine Gael
Patrick Governey*
4.9%
255
257
278
289
299
306
308
322
Fine Gael
Sean Whelan
4.8%
253
261
275
275
289
301
308
336
407
Fianna Fáil
Joe McDonald
4.7%
243
253
256
263
277
282
282
Labour
Cecil Whelan
4.6%
238
242
245
257
Independent
James Brady
3.8%
201
202
204
Independent
Sean Prendergast
1.4%
73
Electorate: 10,567 Valid: 5,223 (49.43%) Spoilt: 43 Quota: 653 Turnout: 5,265 (49.82%)
Muinebheag
Muinebheag - 5 seats
Party
Candidate
FPv% Count
1
2
3
4
5
6
7
8
9
Labour
John McNally *
21.7%
980
Labour
Jim Townsend 18.1%
818
Fianna Fáil
Arthur McDonald
11%
496
568
581
589
614
631
713
851
Fianna Fáil
Enda Nolan
9.5%
427
444
451
462
478
526
559
593
648
Fine Gael
Mary McDonald *
8.7%
392
409
413
422
509
651
695
795
Fianna Fáil
Martin Nevin*
6.8%
305
332
337
344
361
371
475
527
571
Fianna Fáil
Eddie Cullen
6.5%
292
306
312
314
321
330
Independent
Denis Foley
5.9%
264
298
329
336
376
409
437
Fine Gael
Ann Brennan
5.5%
246
250
252
273
311
Fine Gael
Stephen Maher
5%
224
246
249
250
Independent
John Curran
1.2%
56
74
Independent
William Dillon
0.2%
9
12
Electorate: 7,033 Valid: 4,509 (64.11%) Spoilt: 42 Quota: 752 Turnout: 4,551 (64.71%)
Tullow
Tullow - 5 seats
Party
Candidate
FPv% Count
1
2
3
4
5
6
7
Fine Gael
Michael Deering *
17.3%
683
627
639
649
690
860
Fianna Fáil
John Pender *
16.6%
656
658
687
Fine Gael
Pat O'Toole
13.8%
548
551
552
553
558
680
Fine Gael
Fred Hunter
11.3%
449
459
472
472
478
569
617
Labour
Michael Hickey
9.8%
389
407
430
432
435
482
537
Fianna Fáil
Arthur Kennedy *
9%
358
370
417
430
432
452
585
Fine Gael
Brendan Brophy*
8%
317
323
327
330
335
Fianna Fáil
Paddy Condon
6.4%
252
285
340
344
346
368
Fianna Fáil
Mary Ann Dunne
4.2%
165
186
Independent
Bill Leonard
3.5%
140
Electorate: 6,338 Valid: 3,957 (62.43%) Spoilt: 58 Quota: 660 Turnout: 4,015 (63.35%)
References
No. 8 of 1994, s. 20 ). Enacted on 29 April 1994. Act of the Oireachtas . Retrieved from Irish Statute Book .
No. 16 of 1998, s. 10 ). Enacted on 29 May 1998. Act of the Oireachtas . Retrieved from Irish Statute Book .
External links
Categories :
Text is available under the Creative Commons Attribution-ShareAlike License. Additional terms may apply.
**DISCLAIMER** We are not affiliated with Wikipedia, and Cloudflare.
The information presented on this site is for general informational purposes only and does not constitute medical advice.
You should always have a personal consultation with a healthcare professional before making changes to your diet, medication, or exercise routine.
AI helps with the correspondence in our chat.
We participate in an affiliate program. If you buy something through a link, we may earn a commission 💕
↑
 Map showing the area of Carlow County Council