| This article needs additional citations for verification. Please help improve this article by adding citations to reliable sources. Unsourced material may be challenged and removed. Find sources: "1999 South African general election" – news · newspapers · books · scholar · JSTOR (December 2009) (Learn how and when to remove this message) |
| |||||||||||||||||||||||||||||||||||||||||||||||||||||||||||||||||||||||||||||||||||||
| ← outgoing memberselected members → | |||||||||||||||||||||||||||||||||||||||||||||||||||||||||||||||||||||||||||||||||||||
All 400 seats in the National Assembly 201 seats needed for a majority | |||||||||||||||||||||||||||||||||||||||||||||||||||||||||||||||||||||||||||||||||||||
|---|---|---|---|---|---|---|---|---|---|---|---|---|---|---|---|---|---|---|---|---|---|---|---|---|---|---|---|---|---|---|---|---|---|---|---|---|---|---|---|---|---|---|---|---|---|---|---|---|---|---|---|---|---|---|---|---|---|---|---|---|---|---|---|---|---|---|---|---|---|---|---|---|---|---|---|---|---|---|---|---|---|---|---|---|---|
| Registered | 18,172,751 | ||||||||||||||||||||||||||||||||||||||||||||||||||||||||||||||||||||||||||||||||||||
| Turnout | 89.30% ( | ||||||||||||||||||||||||||||||||||||||||||||||||||||||||||||||||||||||||||||||||||||
| |||||||||||||||||||||||||||||||||||||||||||||||||||||||||||||||||||||||||||||||||||||
 | |||||||||||||||||||||||||||||||||||||||||||||||||||||||||||||||||||||||||||||||||||||
| This article is part of a series on the |
| Politics of South Africa |
|---|
 |
| Constitution |
| Executive |
| Legislature |
| Judiciary |
| Elections |
| Administrative divisions |
|
Foreign relations
|
| Related topics |
| Provincial politics |
|
|
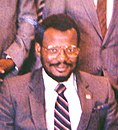
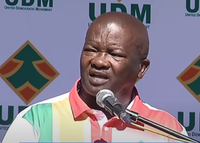
General elections were held in South Africa on 2 June 1999. The result was a landslide victory for the governing African National Congress (ANC), which gained fourteen seats. Incumbent president Nelson Mandela declined to seek re-election as president on grounds of his age. This election was notable for the sharp decline of the New National Party, previously the National Party (NP), which without former State President F. W. de Klerk lost more than half of their former support base. The liberal Democratic Party became the largest opposition party, after being the fifth largest party in the previous elections in 1994. The number of parties represented in the National Assembly increased to thirteen, with the United Democratic Movement, jointly headed by former National Party member Roelf Meyer, and former ANC member Bantu Holomisa, being the most successful of the newcomers with fourteen seats.
National Assembly results
 | |||||
|---|---|---|---|---|---|
| Party | Votes | % | Seats | +/– | |
| African National Congress | 10,601,330 | 66.35 | 266 | +14 | |
| Democratic Party | 1,527,337 | 9.56 | 38 | +31 | |
| Inkatha Freedom Party | 1,371,477 | 8.58 | 34 | −9 | |
| New National Party | 1,098,215 | 6.87 | 28 | −54 | |
| United Democratic Movement | 546,790 | 3.42 | 14 | New | |
| African Christian Democratic Party | 228,975 | 1.43 | 6 | +4 | |
| Freedom Front | 127,217 | 0.80 | 3 | −6 | |
| United Christian Democratic Party | 125,280 | 0.78 | 3 | New | |
| Pan Africanist Congress | 113,125 | 0.71 | 3 | −2 | |
| Federal Alliance | 86,704 | 0.54 | 2 | New | |
| Minority Front | 48,277 | 0.30 | 1 | +1 | |
| Afrikaner Eenheidsbeweging | 46,292 | 0.29 | 1 | New | |
| Azanian People's Organisation | 27,257 | 0.17 | 1 | New | |
| Abolition of Income Tax and Usury Party | 10,611 | 0.07 | 0 | New | |
| Government by the People Green Party | 9,193 | 0.06 | 0 | New | |
| Socialist Party of Azania | 9,062 | 0.06 | 0 | New | |
| Total | 15,977,142 | 100.00 | 400 | 0 | |
| Valid votes | 15,977,142 | 98.45 | |||
| Invalid/blank votes | 251,320 | 1.55 | |||
| Total votes | 16,228,462 | 100.00 | |||
| Registered voters/turnout | 18,172,751 | 89.30 | |||
| Source: Election Resources | |||||
Provincial legislature results
| Party | EC | FS | G | KZN | M | NW | NC | NP | WC | |
|---|---|---|---|---|---|---|---|---|---|---|
| African National Congress | 47 | 25 | 50 | 32 | 26 | 27 | 20 | 44 | 18 | |
| New National Party | 2 | 2 | 3 | 3 | 1 | 1 | 8 | 1 | 17 | |
| Inkatha Freedom Party | 0 | 0 | 3 | 34 | 0 | 0 | 0 | 0 | 0 | |
| Democratic Party | 4 | 2 | 13 | 7 | 1 | 1 | 1 | 1 | 5 | |
| United Democratic Movement | 9 | 0 | 1 | 1 | 1 | 0 | 0 | 1 | 1 | |
| Freedom Front | 0 | 1 | 1 | 0 | 1 | 1 | 1 | 0 | 0 | |
| African Christian Democratic Party | 0 | 0 | 1 | 1 | 0 | 0 | 0 | 1 | 1 | |
| United Christian Democratic Party | – | 0 | 0 | – | 0 | 3 | – | – | – | |
| Minority Front | – | – | – | 2 | – | – | – | – | – | |
| Pan Africanist Congress of Azania | 1 | 0 | 0 | 0 | 0 | 0 | 0 | 1 | 0 | |
| Federal Alliance | 0 | 0 | 1 | 0 | 0 | 0 | 0 | 0 | 0 | |
| Total | 63 | 30 | 73 | 80 | 30 | 33 | 30 | 49 | 42 | |
Eastern Cape
| Party | Votes | % | Seats | +/– | |
|---|---|---|---|---|---|
| African National Congress | 1,606,856 | 73.80 | 47 | −1 | |
| United Democratic Movement | 296,015 | 13.60 | 9 | New | |
| Democratic Party | 136,859 | 6.29 | 4 | +3 | |
| New National Party | 70,141 | 3.22 | 2 | −4 | |
| Pan Africanist Congress | 24,837 | 1.14 | 1 | 0 | |
| African Christian Democratic Party | 20,857 | 0.96 | 0 | 0 | |
| Freedom Front | 7,287 | 0.33 | 0 | 0 | |
| Inkatha Freedom Party | 7,166 | 0.33 | 0 | 0 | |
| Afrikaner Eenheidsbeweging | 3,673 | 0.17 | 0 | New | |
| Federal Alliance | 3,575 | 0.16 | 0 | New | |
| Total | 2,177,266 | 100.00 | 63 | +7 | |
| Valid votes | 2,177,266 | 98.62 | |||
| Invalid/blank votes | 30,469 | 1.38 | |||
| Total votes | 2,207,735 | 100.00 | |||
| Registered voters/turnout | 2,454,543 | 89.94 | |||
| Source: Election Resources | |||||
Free State
| Party | Votes | % | Seats | +/– | |
|---|---|---|---|---|---|
| African National Congress | 881,381 | 80.79 | 25 | +1 | |
| Democratic Party | 58,163 | 5.33 | 2 | +2 | |
| New National Party | 56,740 | 5.20 | 2 | −2 | |
| Freedom Front | 22,996 | 2.11 | 1 | −1 | |
| United Democratic Movement | 18,194 | 1.67 | 0 | New | |
| Pan Africanist Congress | 12,548 | 1.15 | 0 | 0 | |
| African Christian Democratic Party | 9,827 | 0.90 | 0 | 0 | |
| Federal Alliance | 8,798 | 0.81 | 0 | New | |
| United Christian Democratic Party | 8,543 | 0.78 | 0 | New | |
| Inkatha Freedom Party | 5,119 | 0.47 | 0 | 0 | |
| Afrikaner Eenheidsbeweging | 4,390 | 0.40 | 0 | New | |
| Unemployment Labour Alliance | 2,974 | 0.27 | 0 | New | |
| Socialist Party of Azania | 1,235 | 0.11 | 0 | New | |
| Total | 1,090,908 | 100.00 | 30 | 0 | |
| Valid votes | 1,090,908 | 98.47 | |||
| Invalid/blank votes | 16,943 | 1.53 | |||
| Total votes | 1,107,851 | 100.00 | |||
| Registered voters/turnout | 1,225,730 | 90.38 | |||
| Source: Election Resources | |||||
Gauteng
| Party | Votes | % | Seats | +/– | |
|---|---|---|---|---|---|
| African National Congress | 2,488,780 | 67.87 | 50 | 0 | |
| Democratic Party | 658,236 | 17.95 | 13 | +8 | |
| New National Party | 142,579 | 3.89 | 3 | −18 | |
| Inkatha Freedom Party | 128,807 | 3.51 | 3 | 0 | |
| United Democratic Movement | 71,630 | 1.95 | 1 | New | |
| Freedom Front | 45,750 | 1.25 | 1 | −4 | |
| African Christian Democratic Party | 42,621 | 1.16 | 1 | 0 | |
| Federal Alliance | 32,494 | 0.89 | 1 | New | |
| Pan Africanist Congress | 26,781 | 0.73 | 0 | −1 | |
| Afrikaner Eenheidsbeweging | 11,450 | 0.31 | 0 | New | |
| United Christian Democratic Party | 8,642 | 0.24 | 0 | New | |
| Azanian People's Organisation | 5,896 | 0.16 | 0 | New | |
| Socialist Party of Azania | 1,990 | 0.05 | 0 | New | |
| Labor Party | 1,096 | 0.03 | 0 | New | |
| Total | 3,666,752 | 100.00 | 73 | –13 | |
| Valid votes | 3,666,752 | 98.90 | |||
| Invalid/blank votes | 40,843 | 1.10 | |||
| Total votes | 3,707,595 | 100.00 | |||
| Registered voters/turnout | 4,154,087 | 89.25 | |||
| Source: Election Resources | |||||
KwaZulu-Natal
| Party | Votes | % | Seats | +/– | |
|---|---|---|---|---|---|
| Inkatha Freedom Party | 1,241,522 | 41.90 | 34 | −7 | |
| African National Congress | 1,167,094 | 39.38 | 32 | +6 | |
| Democratic Party | 241,779 | 8.16 | 7 | +5 | |
| New National Party | 97,077 | 3.28 | 3 | −6 | |
| Minority Front | 86,770 | 2.93 | 2 | +1 | |
| African Christian Democratic Party | 53,745 | 1.81 | 1 | 0 | |
| United Democratic Movement | 34,586 | 1.17 | 1 | New | |
| Federal Alliance | 9,762 | 0.33 | 0 | New | |
| Pan Africanist Congress | 7,654 | 0.26 | 0 | −1 | |
| Freedom Front | 6,804 | 0.23 | 0 | 0 | |
| Afrikaner Eenheidsbeweging | 5,801 | 0.20 | 0 | New | |
| Azanian People's Organisation | 5,052 | 0.17 | 0 | New | |
| Socialist Party of Azania | 3,451 | 0.12 | 0 | New | |
| Mass United Movement | 2,261 | 0.08 | 0 | New | |
| Total | 2,963,358 | 100.00 | 80 | –1 | |
| Valid votes | 2,963,358 | 98.47 | |||
| Invalid/blank votes | 46,141 | 1.53 | |||
| Total votes | 3,009,499 | 100.00 | |||
| Registered voters/turnout | 3,443,978 | 87.38 | |||
| Source: Election Resources | |||||
Mpumalanga
| Party | Votes | % | Seats | +/– | |
|---|---|---|---|---|---|
| African National Congress | 954,788 | 84.83 | 26 | +1 | |
| Democratic Party | 50,421 | 4.48 | 1 | +1 | |
| New National Party | 27,909 | 2.48 | 1 | −2 | |
| Freedom Front | 19,170 | 1.70 | 1 | −1 | |
| United Democratic Movement | 16,013 | 1.42 | 1 | New | |
| Inkatha Freedom Party | 15,901 | 1.41 | 0 | 0 | |
| African Christian Democratic Party | 12,586 | 1.12 | 0 | 0 | |
| Federal Alliance | 9,019 | 0.80 | 0 | New | |
| Pan Africanist Congress | 7,296 | 0.65 | 0 | 0 | |
| Afrikaner Eenheidsbeweging | 4,520 | 0.40 | 0 | New | |
| Sindawonye Progressive Party | 4,318 | 0.38 | 0 | New | |
| United Christian Democratic Party | 2,553 | 0.23 | 0 | New | |
| Azanian People's Organisation | 1,090 | 0.10 | 0 | New | |
| Total | 1,125,584 | 100.00 | 30 | 0 | |
| Valid votes | 1,125,584 | 98.13 | |||
| Invalid/blank votes | 21,502 | 1.87 | |||
| Total votes | 1,147,086 | 100.00 | |||
| Registered voters/turnout | 1,277,783 | 89.77 | |||
| Source: Election Resources | |||||
North West
| Party | Votes | % | Seats | +/– | |
|---|---|---|---|---|---|
| African National Congress | 1,030,901 | 78.97 | 27 | +1 | |
| United Christian Democratic Party | 124,874 | 9.57 | 3 | New | |
| Democratic Party | 42,593 | 3.26 | 1 | +1 | |
| New National Party | 29,931 | 2.29 | 1 | −2 | |
| Freedom Front | 17,964 | 1.38 | 1 | 0 | |
| United Democratic Movement | 16,785 | 1.29 | 0 | New | |
| African Christian Democratic Party | 12,227 | 0.94 | 0 | 0 | |
| Pan Africanist Congress | 9,613 | 0.74 | 0 | 0 | |
| Federal Alliance | 7,157 | 0.55 | 0 | New | |
| Inkatha Freedom Party | 6,759 | 0.52 | 0 | 0 | |
| Afrikaner Eenheidsbeweging | 6,637 | 0.51 | 0 | New | |
| Total | 1,305,441 | 100.00 | 33 | +3 | |
| Valid votes | 1,305,441 | 98.36 | |||
| Invalid/blank votes | 21,722 | 1.64 | |||
| Total votes | 1,327,163 | 100.00 | |||
| Registered voters/turnout | 1,527,672 | 86.87 | |||
| Source: Election Resources | |||||
Northern Cape
| Party | Votes | % | Seats | +/– | |
|---|---|---|---|---|---|
| African National Congress | 210,837 | 64.32 | 20 | +5 | |
| New National Party | 79,214 | 24.17 | 8 | −4 | |
| Democratic Party | 15,632 | 4.77 | 1 | 0 | |
| Freedom Front | 5,446 | 1.66 | 1 | −1 | |
| African Christian Democratic Party | 5,004 | 1.53 | 0 | 0 | |
| United Democratic Movement | 2,936 | 0.90 | 0 | New | |
| Pan Africanist Congress | 2,158 | 0.66 | 0 | 0 | |
| Federal Alliance | 1,735 | 0.53 | 0 | New | |
| Inkatha Freedom Party | 1,728 | 0.53 | 0 | 0 | |
| Afrikaner Eenheidsbeweging | 1,722 | 0.53 | 0 | New | |
| Azanian People's Organisation | 1,360 | 0.41 | 0 | New | |
| Total | 327,772 | 100.00 | 30 | 0 | |
| Valid votes | 327,772 | 98.53 | |||
| Invalid/blank votes | 4,897 | 1.47 | |||
| Total votes | 332,669 | 100.00 | |||
| Registered voters/turnout | 377,173 | 88.20 | |||
| Source: Election Resources | |||||
Northern Province
| Party | Votes | % | Seats | +/– | |
|---|---|---|---|---|---|
| African National Congress | 1,464,432 | 88.29 | 44 | +6 | |
| United Democratic Movement | 41,700 | 2.51 | 1 | New | |
| New National Party | 28,159 | 1.70 | 1 | 0 | |
| Democratic Party | 23,486 | 1.42 | 1 | +1 | |
| Pan Africanist Congress | 23,325 | 1.41 | 1 | +1 | |
| African Christian Democratic Party | 18,281 | 1.10 | 1 | +1 | |
| Ximoko Party | 13,817 | 0.83 | 0 | 0 | |
| Freedom Front | 10,727 | 0.65 | 0 | −1 | |
| Azanian People's Organisation | 8,931 | 0.54 | 0 | New | |
| Dabalorivhuwa Patriotic Front | 8,229 | 0.50 | 0 | New | |
| Afrikaner Eenheidsbeweging | 6,598 | 0.40 | 0 | New | |
| Inkatha Freedom Party | 5,644 | 0.34 | 0 | 0 | |
| Federal Alliance | 5,365 | 0.32 | 0 | New | |
| Total | 1,658,694 | 100.00 | 49 | +9 | |
| Valid votes | 1,658,694 | 98.51 | |||
| Invalid/blank votes | 25,137 | 1.49 | |||
| Total votes | 1,683,831 | 100.00 | |||
| Registered voters/turnout | 1,847,766 | 91.13 | |||
| Source: Election Resources | |||||
Western Cape
| Party | Votes | % | Seats | +/– | |
|---|---|---|---|---|---|
| African National Congress | 668,106 | 42.07 | 18 | +4 | |
| New National Party | 609,612 | 38.39 | 17 | −6 | |
| Democratic Party | 189,183 | 11.91 | 5 | +2 | |
| African Christian Democratic Party | 44,323 | 2.79 | 1 | 0 | |
| United Democratic Movement | 38,071 | 2.40 | 1 | New | |
| Africa Moral Party | 9,513 | 0.60 | 0 | 0 | |
| Pan Africanist Congress | 7,708 | 0.49 | 0 | 0 | |
| Freedom Front | 6,394 | 0.40 | 0 | −1 | |
| Federal Alliance | 4,153 | 0.26 | 0 | New | |
| Inkatha Freedom Party | 2,895 | 0.18 | 0 | 0 | |
| Afrikaner Eenheidsbeweging | 2,854 | 0.18 | 0 | New | |
| Government by the People Green Party | 2,453 | 0.15 | 0 | 0 | |
| National Coalition Party | 1,126 | 0.07 | 0 | New | |
| People's Liberation Party | 915 | 0.06 | 0 | New | |
| Workers International Vanguard League | 672 | 0.04 | 0 | 0 | |
| Total | 1,587,978 | 100.00 | 42 | 0 | |
| Valid votes | 1,587,978 | 99.16 | |||
| Invalid/blank votes | 13,499 | 0.84 | |||
| Total votes | 1,601,477 | 100.00 | |||
| Registered voters/turnout | 1,864,019 | 85.92 | |||
| Source: Election Resources | |||||
NCOP seats
The National Council of Provinces (NCOP) consists of 90 members, ten elected by each provincial legislature. The Members of NCOP have to be elected in proportion to the party membership of the provincial legislature.
| Party | Delegate type | EC | FS | G | KZN | M | NW | NC | NP | WC | Total | ||
|---|---|---|---|---|---|---|---|---|---|---|---|---|---|
| African National Congress | Permanent | 4 | 4 | 4 | 2 | 5 | 4 | 4 | 5 | 2 | 34 | 63 | |
| Special | 3 | 4 | 3 | 2 | 4 | 4 | 3 | 4 | 2 | 29 | |||
| New National Party | Permanent | 1 | 1 | 1 | 2 | 2 | 7 | 10 | |||||
| Special | 1 | 2 | 3 | ||||||||||
| Democratic Party | Permanent | 1 | 1 | 1 | 1 | 1 | 1 | 1 | 7 | 8 | |||
| Special | 1 | 1 | |||||||||||
| Inkatha Freedom Party | Permanent | 2 | 2 | 4 | |||||||||
| Special | 2 | 2 | |||||||||||
| United Democratic Movement | Permanent | 1 | 1 | 2 | 3 | ||||||||
| Special | 1 | 1 | |||||||||||
| African Christian Democratic Party | Permanent | 1 | 1 | ||||||||||
| United Christian Democratic Party | Permanent | 1 | 1 | ||||||||||
| Total | 10 | 10 | 10 | 10 | 10 | 10 | 10 | 10 | 10 | 90 | |||
| Source: South Africa Survey 2002/03 | |||||||||||||
Aftermath
Thabo Mbeki was elected president (unopposed) by the new Assembly on 14 June 1999, succeeding Nelson Mandela.
Notes
- As National Party.
References
- South Africa Survey 2002/03. South African Institute of Race Relations. 2003. p. 470.
- Mbeki elected South African president BBC News, 14 June 1999
| General elections | |
|---|---|
| Provincial elections | |
| Municipal elections | |
| Referendums | |


