| ||||||||||||||||||||||||||||||||||
All 67 seats in the Minnesota Senate 34 seats needed for a majority | ||||||||||||||||||||||||||||||||||
|---|---|---|---|---|---|---|---|---|---|---|---|---|---|---|---|---|---|---|---|---|---|---|---|---|---|---|---|---|---|---|---|---|---|---|
| ||||||||||||||||||||||||||||||||||
 Districts by margins of victory
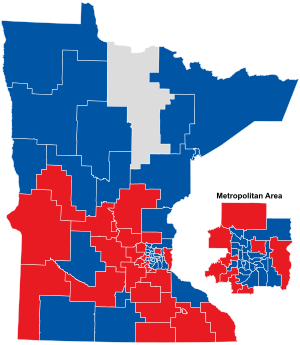
 Districts by party won
 | ||||||||||||||||||||||||||||||||||
| ||||||||||||||||||||||||||||||||||
The 2000 Minnesota Senate election was held in the U.S. state of Minnesota on November 7, 2000, to elect members to the Senate of the 82nd Minnesota Legislature. A primary election was held on September 12, 2000.
The Minnesota Democratic–Farmer–Labor Party (DFL) won a majority of seats, remaining the majority party, followed by the Republican Party of Minnesota and one independent. The new Legislature convened on January 3, 2001.
Results
| Party | Candidates | Votes | Seats | |||
|---|---|---|---|---|---|---|
| No. | ∆No. | % | ||||
| Minnesota Democratic–Farmer–Labor Party | 67 | 1,219,497 | 39 | 58.21 | ||
| Republican Party of Minnesota | 64 | 1,040,132 | 27 | 40.30 | ||
| Independence Party of Minnesota | 10 | 29,534 | 0 | 0.00 | ||
| Constitution Party of Minnesota | 4 | 7,078 | 0 | 0.00 | ||
| Independent | 2 | 20,380 | 1 | 1.49 | ||
| Total | 67 | ±0 | 100.00 | |||
| Turnout (out of 3,506,432 eligible voters) | 2,458,303 | 70.11% | ||||
| Source: Minnesota Secretary of State, Minnesota Legislative Reference Library | ||||||
See also
References
- "Minnesota election statistics 1950-2014" (PDF). Minnesota Secretary of State. Retrieved August 13, 2016.
- "Results for all State Senators". Minnesota Secretary of State. Retrieved January 16, 2018.
- "Party Control of the Minnesota Senate, 1951-present". Minnesota Legislative Reference Library. Retrieved October 30, 2015.
This Minnesota elections-related article is a stub. You can help Misplaced Pages by expanding it. |
