| |||||||||||||||||||||||||||||||||||||||||||||||||||||
All 67 seats to Northumberland County Council 34 seats needed for a majority | |||||||||||||||||||||||||||||||||||||||||||||||||||||
|---|---|---|---|---|---|---|---|---|---|---|---|---|---|---|---|---|---|---|---|---|---|---|---|---|---|---|---|---|---|---|---|---|---|---|---|---|---|---|---|---|---|---|---|---|---|---|---|---|---|---|---|---|---|
| Turnout | 61.6% | ||||||||||||||||||||||||||||||||||||||||||||||||||||
| |||||||||||||||||||||||||||||||||||||||||||||||||||||
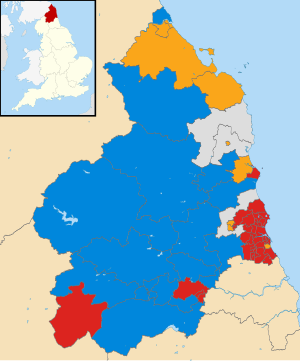
 Map of the results of the 2001 local election. Map of the results of the 2001 local election. | |||||||||||||||||||||||||||||||||||||||||||||||||||||
| |||||||||||||||||||||||||||||||||||||||||||||||||||||
Local elections to Northumberland County Council, a county council in the north east of England, were held on 7 June 2001. It was the first election to be held under new ward boundaries that increased the number of seats from 66 to 67. The Labour Party retained overall control of the council.
Results
| Party | Seats | Gains | Losses | Net gain/loss | Seats % | Votes % | Votes | +/− | |
|---|---|---|---|---|---|---|---|---|---|
| Labour | 38 | 40.7 | |||||||
| Conservative | 17 | 24.5 | |||||||
| Liberal Democrats | 9 | 29.7 | |||||||
| Independent | 3 | 4.6 | |||||||
| Green | 0 | 0.0 | 0.5 | ||||||
References
- "Local Election Summaries 2001". The Elections Centre. Retrieved 21 June 2019.
- "Vote 2001". BBC News.
- p.11