| |||||||||||||||||||||||||||||||||||||
11 of the 33 seats to City of Lincoln Council 17 seats needed for a majority | |||||||||||||||||||||||||||||||||||||
|---|---|---|---|---|---|---|---|---|---|---|---|---|---|---|---|---|---|---|---|---|---|---|---|---|---|---|---|---|---|---|---|---|---|---|---|---|---|
| |||||||||||||||||||||||||||||||||||||
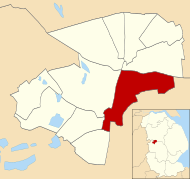
 Map showing the results of the 2006 Lincoln City Council elections by ward. Red shows Labour seats, blue shows Conservative seats and orange shows Liberal Democrat seats. Map showing the results of the 2006 Lincoln City Council elections by ward. Red shows Labour seats, blue shows Conservative seats and orange shows Liberal Democrat seats. | |||||||||||||||||||||||||||||||||||||
| |||||||||||||||||||||||||||||||||||||
Elections to City of Lincoln Council in Lincolnshire, England, were held on 4 May 2006. One third of the Council was up for election and the Labour Party stayed in overall control of the Council.
After the election, the composition of the council was:
- Labour 25
- Conservative 7
- Liberal Democrat 1
Election result
| Party | Seats | Gains | Losses | Net gain/loss | Seats % | Votes % | Votes | +/− | |
|---|---|---|---|---|---|---|---|---|---|
| Conservative | 6 | 4 | 0 | 54.5 | 43.6 | 7,693 | |||
| Labour | 4 | 0 | 5 | 36.4 | 40.1 | 7,063 | |||
| Liberal Democrats | 1 | 1 | 0 | 9.1 | 7.8 | 1,371 | New | ||
| UKIP | 0 | 0 | 0 | 0.0 | 8.5 | 1,506 | New | ||
| Total | 11 | 17,633 |
| ||||||
All comparisons in vote share are to the corresponding 2002 election.
Ward results
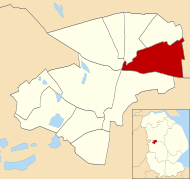
Abbey
| Party | Candidate | Votes | % | |
|---|---|---|---|---|
| Labour | Peter West | 716 | 61.8% | |
| Conservative | John Woolf | 443 | 38.2% | |
| Majority | 273 | 23.6% | ||
| Turnout | 1,159 | 25.3% | ||
| Labour hold | ||||
Birchwood

| Party | Candidate | Votes | % | |
|---|---|---|---|---|
| Conservative | John Metcalfe | 810 | 48.2% | |
| Labour | Lynne Gray | 577 | 34.4% | |
| UKIP | Anthony Wells | 292 | 17.4% | |
| Majority | 233 | 13.8% | ||
| Turnout | 1,679 | 29.2% | ||
| Conservative hold | ||||
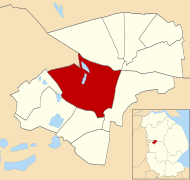
Boultham
| Party | Candidate | Votes | % | |
|---|---|---|---|---|
| Labour | Gary Hewson | 819 | 51.4% | |
| Conservative | Oliver Peeke | 542 | 34.0% | |
| UKIP | Malcolm Skeels | 233 | 14.6% | |
| Majority | 277 | 17.4% | ||
| Turnout | 1,594 | 28.8% | ||
| Labour hold | ||||
Bracebridge

| Party | Candidate | Votes | % | |
|---|---|---|---|---|
| Conservative | Darren Grice | 1,209 | 62.0% | |
| Labour | David Rimmington | 740 | 38.0% | |
| Majority | 469 | 24.0% | ||
| Turnout | 1,949 | 31.1% | ||
| Conservative hold | ||||
Carholme

| Party | Candidate | Votes | % | |
|---|---|---|---|---|
| Labour | Lesley Rose | 594 | 37.0% | |
| Liberal Democrats | Charles Shaw | 551 | 34.4% | |
| Conservative | Valerie Kirby | 459 | 28.6% | |
| Majority | 43 | 2.6% | ||
| Turnout | 1,604 | 30.4% | ||
| Labour hold | ||||
Castle

| Party | Candidate | Votes | % | |
|---|---|---|---|---|
| Labour | Loraine Woolley | 690 | 51.5% | |
| Conservative | Adrian Birks | 440 | 32.8% | |
| UKIP | Peter Sharpe | 211 | 15.7% | |
| Majority | 250 | 18.7% | ||
| Turnout | 1,341 | 27.5% | ||
| Labour hold | ||||
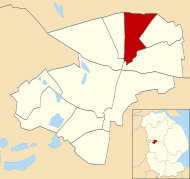
Glebe
| Party | Candidate | Votes | % | |
|---|---|---|---|---|
| Conservative | Claire Metcalfe | 586 | 34.6% | |
| Labour | Julian Gadd | 566 | 33.5% | |
| Liberal Democrats | Roy Harris | 338 | 20.0% | |
| UKIP | Jamie Corney | 202 | 11.9% | |
| Majority | 20 | 1.1% | ||
| Turnout | 1,692 | 26.0% | ||
| Conservative gain from Labour | ||||
Hartsholme

| Party | Candidate | Votes | % | |
|---|---|---|---|---|
| Conservative | Geoffrey Kirby | 1,038 | 50.3% | |
| Labour | Winston Duncan | 634 | 30.7% | |
| UKIP | Nicola Smith | 391 | 19.0% | |
| Majority | 404 | 19.6% | ||
| Turnout | 2,063 | 30.6% | ||
| Conservative hold | ||||
Minster

| Party | Candidate | Votes | % | |
|---|---|---|---|---|
| Conservative | Sandra Gratrick | 963 | 52.2% | |
| Labour | Patrick Vaughan | 706 | 38.2% | |
| UKIP | Nicholas Smith | 177 | 9.6% | |
| Majority | 257 | 14.0% | ||
| Turnout | 1,846 | 34.8% | ||
| Conservative hold | ||||
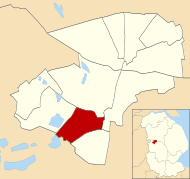
Moorland
| Party | Candidate | Votes | % | |
|---|---|---|---|---|
| Conservative | Paul Grice | 899 | 55.8% | |
| Labour | Martin Bushell | 713 | 44.2% | |
| Majority | 186 | 11.6% | ||
| Turnout | 1,612 | 28.4% | ||
| Conservative gain from Labour | ||||
Park
| Party | Candidate | Votes | % | |
|---|---|---|---|---|
| Liberal Democrats | Ryan Cullen | 482 | 44.1% | |
| Labour | Malcolm Withers | 308 | 28.2% | |
| Conservative | Jayne Heaton-Harris | 304 | 27.8% | |
| Majority | 174 | 15.9% | ||
| Turnout | 1,094 | 21.8% | ||
| Liberal Democrats gain from Labour | ||||
By-elections between 2006 and 2008
| Party | Candidate | Votes | % | ±% | |
|---|---|---|---|---|---|
| Conservative | Oliver Garbutt Peeke | 640 | 39.9 | ||
| Labour | Martin Bushell | 569 | 35.5 | ||
| BNP | Philip Marshall | 254 | 15.8 | ||
| Liberal Democrats | John Price | 96 | 6.0 | ||
| UKIP | Nicholas Smith | 46 | 2.9 | ||
| Majority | 71 | 4.4 | |||
| Turnout | 1,605 | 28.1 | |||
| Labour gain from Conservative | Swing | ||||
References
- "Council compositions by year". The Elections Centre.
- "Local Election Summaries 2006". The Elections Centre.
- "BBC News - Council by Council - Lincoln". BBC News. Retrieved 4 November 2019.
- ^ Andrew Teale. "Local Election Results - 2006 - Lincoln". Local Elections Archive Project. Retrieved 4 November 2019.
- "Near-miss for Lib Dems in local byelection". The Guardian. London. 30 June 2006. Retrieved 22 November 2009.
| (2005 ←) | |
|---|---|
| London boroughs |
|
| Metropolitan boroughs |
|
| Unitary authorities | |
| District councils (England) |
|