2015 UK local government election
The 2015 Plymouth City Council election took place on 7 May 2015 to elect members of Plymouth City Council in England.
The Labour Party lost its narrow majority, resulting in no party having overall control.
Background
Plymouth City Council held local elections on 7 May 2015 along with councils across the United Kingdom as part of the 2015 local elections . The council elects its councillors in thirds, with a third being up for election every year for three years, with no election in the fourth year.
Councillors defending their seats in this election were previously elected in 2011. In that election, twelve Labour candidates and eight Conservative candidates were elected. Two Labour candidates had been elected in St Peter and the Waterfront due to a by-election coinciding with the council election, only one of whom was defending their seat in this election.
Overall results
2015 Plymouth City Council Election
Party
Seats
Gains
Losses
Net gain/loss
Seats %
Votes %
Votes
+/−
Conservative
10
2
0
52.6
37.8
44,388
Labour
9
0
2
47.4
31.1
36,521
UKIP
3
3
0
15.8
19.9
23,404
Green
0
0
0
0.0
6.2
7,328
Liberal Democrats
0
0
0
0.0
3.4
4,008
TUSC
0
0
0
0.0
0.9
1,025
Independent
0
0
0
0.0
0.5
624
Vivamus
0
0
0
0.0
0.0
50
New
Both Parents Matter
0
0
0
0.0
0.0
36
New
Total
19
117,348
Note: All changes in vote share are in comparison to the corresponding 2011 election .
The Labour Party lost their majority on the council, leaving the council under no overall control.
After the previous election , the composition of the council was:
↓
30
24
3
Labour
Conservative
UKIP
After this election, the composition of the council was:
↓
28
26
3
Labour
Conservative
UKIP
Ward results
Asterisks denote sitting councillors seeking re-election.
Budshead
Location of Budshead ward Compton
Location of Compton ward Devonport
Location of Devonport ward Drake
Location of Drake ward Efford and Lipson
Location of Efford and Lipson ward Eggbuckland
Location of Eggbuckland ward
Eggbuckland 2015
Party
Candidate
Votes
%
±%
Conservative Lynda Bowyer*
3,382
48.0
Labour
Chris Mavin
1,829
25.9
UKIP
Hugh Davies
1,440
20.4
Green
Jonathan Noades
351
5.0
N/A
TUSC
Marc Chudley
51
0.7
N/A
Majority
1,553
22.1
Turnout
7,053
68.2
Conservative hold
Swing
Ham
Location of Ham ward Honicknowle
Location of Honicknowle ward
Honicknowle 2015
Party
Candidate
Votes
%
±%
Labour Mark Lowry*
2,414
41.7
UKIP
Shaun Hooper
1,718
29.7
Conservative
Gloria Bragg
1,371
23.7
Green
Andrew Pratt
211
3.6
Independent
Arthur Watson
38
0.7
N/A
TUSC
George Fidler
37
0.6
N/A
Majority
696
12.0
Turnout
5,789
56.5
Labour hold
Swing
Moor View
Location of Moor View ward Peverell
Location of Peverell ward
Peverell 2015
Party
Candidate
Votes
%
±%
Conservative John Mahony*
3,288
42.9
Labour
Paul McNamara
2,237
29.2
UKIP
Peter Brooksbank
944
12.3
Green
Wendy Miller
624
8.1
N/A
Liberal Democrats
Richard Lawrie
452
5.9
TUSC
Justin Pollard
71
0.9
N/A
Vivamus
Bernard Toolan
71
0.7
N/A
Majority
1,051
13.7
Turnout
7,666
74.2
Conservative hold
Swing
Plympton Erle
Location of Plympton Erle ward Plympton St Mary
Location of Plympton St Mary ward Plymstock Dunstone
Location of Plymstock Dunstone ward Plymstock Radford
Location of Plymstock Radford ward
Plymstock Radford 2015
Party
Candidate
Votes
%
±%
Conservative Ken Foster*
3,417
49.3
UKIP
John Wheeler
1,786
25.8
Labour
Mark Thompson
1,600
23.1
TUSC
Thomas Sloman
126
1.8
N/A
Majority
1,631
23.5
Turnout
6,929
70.0
Conservative hold
Swing
Southway
Location of Southway ward St Budeaux
Location of St Budeaux ward
St Budeaux 2015
Party
Candidate
Votes
%
±%
Labour George Wheeler*
2,137
39.0
Conservative
James Carlyle
1,537
28.1
UKIP
Adam Duffield
1,486
27.2
Green
Mark Ovenden
257
4.7
N/A
TUSC
Aaron Smith
56
1.0
N/A
Majority
600
10.9
Turnout
5,473
56.2
Labour hold
Swing
Stoke
Location of Stoke ward St Peter and the Waterfront
Sutton and Mount Gould
Location of Sutton and Mount Gould ward Aftermath
The Labour Party lost control of the council, remaining the largest party with one seat short of an overall majority.
References
"Upcoming elections & referendums" . The Electoral Commission . Archived from the original on 15 March 2015. Retrieved 1 April 2015."Local government structure and elections" . GOV.UK . Retrieved 27 April 2018."Election Timetable in England" (PDF). assets.publishing.service.gov.uk . Archived (PDF) from the original on 28 April 2018."Past election results | PLYMOUTH.GOV.UK" . www.plymouth.gov.uk . Archived from the original on 28 April 2018. Retrieved 27 April 2018."Election 2015: Labour loses control of Plymouth council" . BBC News . 8 May 2015."Your Councillors by Party" . plymouth.gov.uk . Archived from the original on 1 October 2015."Local Elections Archive Project - 2015 - Plymouth" . www.andrewteale.me.uk ."Labour loses majority in Plymouth" . BBC News . 8 May 2015. Retrieved 17 November 2018.
Categories :
Text is available under the Creative Commons Attribution-ShareAlike License. Additional terms may apply.
**DISCLAIMER** We are not affiliated with Wikipedia, and Cloudflare.
The information presented on this site is for general informational purposes only and does not constitute medical advice.
You should always have a personal consultation with a healthcare professional before making changes to your diet, medication, or exercise routine.
AI helps with the correspondence in our chat.
We participate in an affiliate program. If you buy something through a link, we may earn a commission 💕
↑
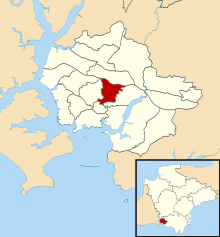
 Map showing the results of contested positions in the 2015 Plymouth City Council elections.


