| |||||||||||||||||||||||||||||||||||||||||||||||||||||||||||||||||||||||||||||||||||||||||||||||||||||||||||||||||||||||
All 23 seats to Sham Shui Po District Council 12 seats needed for a majority | |||||||||||||||||||||||||||||||||||||||||||||||||||||||||||||||||||||||||||||||||||||||||||||||||||||||||||||||||||||||
|---|---|---|---|---|---|---|---|---|---|---|---|---|---|---|---|---|---|---|---|---|---|---|---|---|---|---|---|---|---|---|---|---|---|---|---|---|---|---|---|---|---|---|---|---|---|---|---|---|---|---|---|---|---|---|---|---|---|---|---|---|---|---|---|---|---|---|---|---|---|---|---|---|---|---|---|---|---|---|---|---|---|---|---|---|---|---|---|---|---|---|---|---|---|---|---|---|---|---|---|---|---|---|---|---|---|---|---|---|---|---|---|---|---|---|---|---|---|---|---|
| Turnout | 50.2% | ||||||||||||||||||||||||||||||||||||||||||||||||||||||||||||||||||||||||||||||||||||||||||||||||||||||||||||||||||||||
| |||||||||||||||||||||||||||||||||||||||||||||||||||||||||||||||||||||||||||||||||||||||||||||||||||||||||||||||||||||||
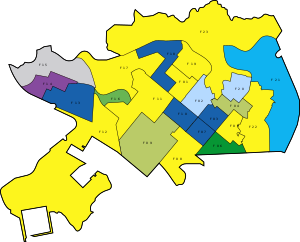
 Colours on map indicate winning party for each constituency. Colours on map indicate winning party for each constituency. | |||||||||||||||||||||||||||||||||||||||||||||||||||||||||||||||||||||||||||||||||||||||||||||||||||||||||||||||||||||||
The 2015 Sham Shui Po District Council election was held on 22 November 2015 to elect all 23 members to the Sham Shui Po District Council.
Veteran legislator Frederick Fung Kin-kee of the Hong Kong Association for Democracy and People's Livelihood (ADPL) lost his seat in Lai Kok to Chan Wing-yan of the Democratic Alliance for the Betterment and Progress of Hong Kong (DAB) and the Hong Kong Federation of Trade Unions (FTU).
Overall election results
Before election:
| 7 | 14 |
| Pro-democracy | Pro-Beijing |
Change in composition:
| 11 | 12 |
| Pro-democracy | Pro-Beijing |
| Party | Seats | Gains | Losses | Net gain/loss | Seats % | Votes % | Votes | +/− | |
|---|---|---|---|---|---|---|---|---|---|
| ADPL | 9 | 3 | 3 | +2 | 39.1 | 30.1 | 26,318 | −5.5 | |
| KWND | 4 | 0 | 0 | 0 | 17.4 | 20.2 | 17,650 | ||
| DAB | 5 | 1 | 0 | +1 | 21.7 | 17.8 | 15,564 | −1.5 | |
| Independent | 1 | 0 | 0 | 0 | 4.3 | 10.8 | 9,493 | ||
| Civic | 1 | 1 | 0 | +1 | 4.3 | 6.6 | 5,812 | +1.1 | |
| Democratic | 1 | 1 | 0 | +1 | 4.3 | 2.7 | 2,353 | +1.3 | |
| Liberal | 1 | 1 | 0 | +1 | 4.3 | 2.6 | 2,277 | ||
| FTU | 0 | 0 | 0 | 0 | 0 | 1.9 | 1,678 | ||
| FLU | 1 | 0 | 0 | 0 | 4.3 | 1.8 | 1,544 | –0.2 | |
| Civic Passion | 0 | 0 | 0 | 0 | 0 | 1.3 | 1,160 | ||
| Socialist Action | 0 | 0 | 0 | 0 | 0 | 1.3 | 1,152 | ||
| LSD | 0 | 0 | 0 | 0 | 0 | 1.1 | 982 | +0.4 | |
| CYSRC | 0 | 0 | 0 | 0 | 0 | 0.9 | 786 | +0.1 | |
References
- "Election Results - Overall Results". Electoral Affairs Commission.
External links
| Sham Shui Po District Council elections | |
|---|---|
| 2011 ← 2015 Hong Kong local elections → 2019 | |
|---|---|
| Hong Kong Island | |
| Kowloon | |
| New Territories | |