| This article needs additional citations for verification. Please help improve this article by adding citations to reliable sources. Unsourced material may be challenged and removed. Find sources: "Dendrogram" – news · newspapers · books · scholar · JSTOR (January 2017) (Learn how and when to remove this message) |


A dendrogram is a diagram representing a tree. This diagrammatic representation is frequently used in different contexts:
- in hierarchical clustering, it illustrates the arrangement of the clusters produced by the corresponding analyses.
- in computational biology, it shows the clustering of genes or samples, sometimes in the margins of heatmaps.
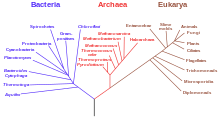
- in phylogenetics, it displays the evolutionary relationships among various biological taxa. In this case, the dendrogram is also called a phylogenetic tree.
The name dendrogram derives from the two ancient greek words δένδρον (déndron), meaning "tree", and γράμμα (grámma), meaning "drawing, mathematical figure".
Clustering example
For a clustering example, suppose that five taxa ( to ) have been clustered by UPGMA based on a matrix of genetic distances. The hierarchical clustering dendrogram would show a column of five nodes representing the initial data (here individual taxa), and the remaining nodes represent the clusters to which the data belong, with the arrows representing the distance (dissimilarity). The distance between merged clusters is monotone, increasing with the level of the merger: the height of each node in the plot is proportional to the value of the intergroup dissimilarity between its two daughters (the nodes on the right representing individual observations all plotted at zero height).
See also
- Cladogram
- Distance matrices in phylogeny
- Hierarchical clustering
- MEGA, a freeware for drawing dendrograms
- yEd, a freeware for drawing and automatically arranging dendrograms
- Taxonomy
References
Citations
- Swofford DL, Olsen GJ, Waddell PJ, Hillis DM (1996). "Phylogenetic inference". In Hillis DM, Moritz C, Mable BK (eds.). Molecular Systematics, 2nd edition. Sunderland, MA: Sinauer. pp. 407–514. ISBN 9780878932825.
- Van Soest R, Boury-Esnault N, Vacelet J, Dohrmann M, Erpenbeck D, De Voogd N, Santodomingo N, Vanhoorne B, Kelly M, Hooper J (2012). "Global Diversity of Sponges (Porifera)". PLOS ONE. 7 (4): e35105. Bibcode:2012PLoSO...735105V. doi:10.1371/journal.pone.0035105. PMC 3338747. PMID 22558119.
- Woese, Carl R.; Kandler, O; Wheelis, M (1990). "Towards a natural system of organisms: proposal for the domains Archaea, Bacteria, and Eucarya" (PDF). Proc Natl Acad Sci USA. 87 (12): 4576–4579. Bibcode:1990PNAS...87.4576W. doi:10.1073/pnas.87.12.4576. PMC 54159. PMID 2112744.
- Everitt, Brian (1998). Dictionary of Statistics. Cambridge, UK: Cambridge University Press. p. 96. ISBN 0-521-59346-8.
- Wilkinson, Leland; Friendly, Michael (May 2009). "The History of the Cluster Heat Map". The American Statistician. 63 (2): 179–184. CiteSeerX 10.1.1.165.7924. doi:10.1198/tas.2009.0033. S2CID 122792460.
- "Phylogenetic tree (biology)". Encyclopedia Britannica. Retrieved 2018-10-22.
- Bailly, Anatole (1981-01-01). Abrégé du dictionnaire grec français. Paris: Hachette. ISBN 2010035283. OCLC 461974285.
- Bailly, Anatole. "Greek-french dictionary online". www.tabularium.be. Retrieved October 20, 2018.
Sources
- Galili, T. (2015). "dendextend: an R package for visualizing, adjusting and comparing trees of hierarchical clustering". Bioinformatics. 31 (22): 3718–3720. doi:10.1093/bioinformatics/btv428. PMC 4817050. PMID 26209431.
External links
- Iris dendrogram - Example of using a dendrogram to visualize the 3 clusters from hierarchical clustering using the "complete" method vs the real species category (using R).
 to
to  ) have been clustered by