| Part of a series on |
| Citation metrics |
|---|
 |
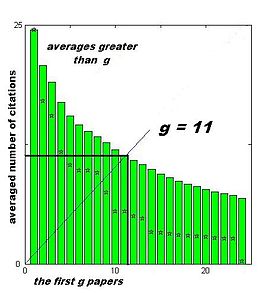
The g-index is an author-level metric suggested in 2006 by Leo Egghe. The index is calculated based on the distribution of citations received by a given researcher's publications, such that given a set of articles ranked in decreasing order of the number of citations that they received, the g-index is the unique largest number such that the top g articles received together at least g citations. Hence, a g-index of 10 indicates that the top 10 publications of an author have been cited at least 100 times (10), a g-index of 20 indicates that the top 20 publications of an author have been cited 400 times (20).
It can be equivalently defined as the largest number n of highly cited articles for which the average number of citations is at least n. This is in fact a rewriting of the definition

as
The g-index is an alternative for the older h-index. The h-index does not average the number of citations. Instead, the h-index only requires a minimum of n citations for the least-cited article in the set and thus ignores the citation count of very highly cited publications. Roughly, the effect is that h is the number of works of a quality threshold that rises as h rises; g allows citations from higher-cited works to be used to bolster lower-cited works in meeting this threshold. In effect, the g-index is the maximum reachable value of the h-index if a fixed number of citations can be distributed freely over a fixed number of publications. Therefore, in all cases g is at least h, and is in most cases higher. The g-index often separates authors based on citations to a greater extent compared to the h-index. However, unlike the h-index, the g-index saturates whenever the average number of citations for all publications exceeds the total number of publications; the way it is defined, the g-index is not adapted to this situation. However, if an author with a saturated g-index publishes more, their g-index will increase.
| Author 1 | Author 2 | |
|---|---|---|
| Work 1 | 30 | 10 |
| Work 2 | 17 | 9 |
| Work 3 | 15 | 9 |
| Work 4 | 13 | 9 |
| Work 5 | 8 | 8 |
| Work 6 | 6 | 6 |
| Work 7 | 5 | 5 |
| Work 8 | 4 | 4 |
| Work 9 | 3 | 2 |
| Work 10 | 1 | 1 |
| Total cites | 102 | 63 |
| Average cites | 10,2 | 6,3 |
The g-index has been characterized in terms of three natural axioms by Woeginger (2008). The simplest of these three axioms states that by moving citations from weaker articles to stronger articles, one's research index should not decrease. Like the h-index, the g-index is a natural number and thus lacks in discriminatory power. Therefore, Tol (2008) proposed a rational generalisation.
Tol also proposed a collective g-index.
- Given a set of researchers ranked in decreasing order of their g-index, the g1-index is the (unique) largest number such that the top g1 researchers have on average at least a g-index of g1.
References
- ^ Egghe, Leo (2006). "Theory and practise of the g-index". Scientometrics. 69 (1): 131–152. doi:10.1007/s11192-006-0144-7. hdl:1942/981. S2CID 207236267.
- Woeginger, Gerhard J. (2008). "An axiomatic analysis of Egghe's g-index". Journal of Informetrics. 2 (4): 364–368. doi:10.1016/j.joi.2008.05.002.
- Tol, Richard S. J. (2008). "A rational, successive g-index applied to economics departments in Ireland". Journal of Informetrics. 2 (2): 149–155. doi:10.1016/j.joi.2008.01.001. Preprint.

