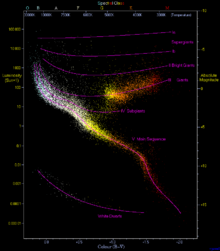
The Hertzsprung gap is a feature of the Hertzsprung–Russell diagram for a star cluster. This diagram is a plot of effective temperature versus luminosity for a population of stars. The gap is named after Ejnar Hertzsprung, who first noticed the absence of stars in the region of the Hertzsprung–Russell diagram between A5 and G0 spectral type and between +1 and −3 absolute magnitudes. This gap lies between the top of the main sequence and the base of red giants for stars above roughly 1.5 solar mass. When a star during its evolution crosses the Hertzsprung gap, it means that it has finished core hydrogen burning.
Stars do exist in the Hertzsprung gap region, but because they move through this section of the Hertzsprung–Russell diagram very quickly in comparison to the lifetime of the star (thousands of years, compared to millions or billions of years for the lifetime of the star), that portion of the diagram is less densely populated. Full Hertzsprung–Russell diagrams of the 11,000 Hipparcos mission targets show a handful of stars in that region.
Well-known stars inside of or towards the end of the Hertzsprung gap include:
Canopus, Iota Carinae, and Upsilon Carinae are also starting to enter the gap.
See also
References
- Hoyle, F (May 7, 1959). "On The Main-Sequence Band and the Hertzsprung Gap". Monthly Notices of the Royal Astronomical Society. 120: 22. Bibcode:1960MNRAS.120...22H. doi:10.1093/mnras/120.1.22.
- Binney, James; Merrifield, Michael (1998-09-06). Galactic Astronomy. Princeton, NJ: Princeton University Press. pp. 266–271. ISBN 978-0-691-02565-0. Table 5.2, Figure 5.2.
- Binney, J. and Merrifield, M., "Galactic Astronomy," Figure 3.5, pp. 102–103, p. 265.
- ^ Neuhäuser, R; Torres, G; Mugrauer, M; Neuhäuser, D L; Chapman, J; Luge, D; Cosci, M (2022-07-29). "Colour evolution of Betelgeuse and Antares over two millennia, derived from historical records, as a new constraint on mass and age". Monthly Notices of the Royal Astronomical Society. 516 (1): 693–719. arXiv:2207.04702. Bibcode:2022MNRAS.516..693N. doi:10.1093/mnras/stac1969. ISSN 0035-8711.
This article about stellar evolution is a stub. You can help Misplaced Pages by expanding it. |