Commune in Brittany, France
| Hillion Hilion | |
|---|---|
| Commune | |
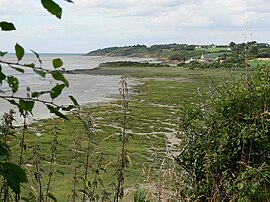
 The Pointe du Grouin, at Hillion The Pointe du Grouin, at Hillion | |
 Flag Flag Coat of arms Coat of arms | |
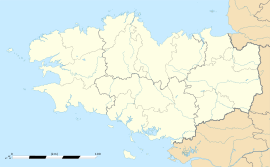
| Location of Hillion | |
  | |
| Coordinates: 48°30′51″N 2°40′03″W / 48.5142°N 2.6675°W / 48.5142; -2.6675 | |
| Country | France |
| Region | Brittany |
| Department | Côtes-d'Armor |
| Arrondissement | Saint-Brieuc |
| Canton | Trégueux |
| Intercommunality | Saint-Brieuc Armor |
| Government | |
| • Mayor (2022–2026) | Annie Guennou |
| Area | 24.76 km (9.56 sq mi) |
| Population | 4,304 |
| • Density | 170/km (450/sq mi) |
| Time zone | UTC+01:00 (CET) |
| • Summer (DST) | UTC+02:00 (CEST) |
| INSEE/Postal code | 22081 /22120 |
| Elevation | 0–86 m (0–282 ft) |
| French Land Register data, which excludes lakes, ponds, glaciers > 1 km (0.386 sq mi or 247 acres) and river estuaries. | |
Hillion (French pronunciation: [iljɔ̃] ; Breton: Helion; Gallo: Hilion) is a commune in the Côtes-d'Armor department of Brittany in northwestern France.
Economy
Mussel farming is an important activity since 10% of French mussels, about 3 000 to 4 000 tons are produced in Hillion. The species are Mytilus galloprovincialis, adapted to the climate, and Mytilus edulis. Each year, the festival "La fete de la moule" (mussels festival) is held in August in the mussels farm.
Population
Inhabitants of Hillion are called hillionnais in French.
|
| ||||||||||||||||||||||||||||||||||||||||||||||||||||||||||||||||||||||||||||||||||||||||||||||||||||||||||||||||||
| Source: EHESS and INSEE (1968-2017) | |||||||||||||||||||||||||||||||||||||||||||||||||||||||||||||||||||||||||||||||||||||||||||||||||||||||||||||||||||
See also
References
- "Répertoire national des élus: les maires" (in French). data.gouv.fr, Plateforme ouverte des données publiques françaises. 6 June 2023.
- "Populations de référence 2022" (in French). The National Institute of Statistics and Economic Studies. 19 December 2024.
- Des villages de Cassini aux communes d'aujourd'hui: Commune data sheet Hillion, EHESS (in French).
- Population en historique depuis 1968, INSEE
External links
- Base Mérimée: Search for heritage in the commune, Ministère français de la Culture. (in French)
This Côtes-d'Armor geographical article is a stub. You can help Misplaced Pages by expanding it. |