County in Utah
| Kane County | |
|---|---|
| County | |
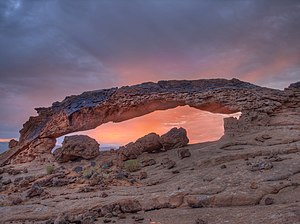
 Narrows in Diana's Throne Canyon, also known as the Huntress Slot in vicinity of Mount Carmel Junction. Narrows in Diana's Throne Canyon, also known as the Huntress Slot in vicinity of Mount Carmel Junction. | |
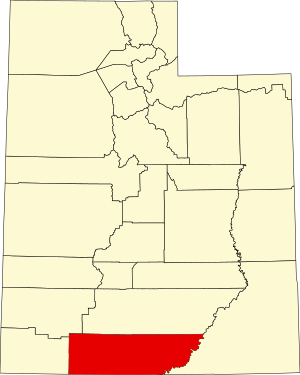
 Location within the U.S. state of Utah Location within the U.S. state of Utah | |
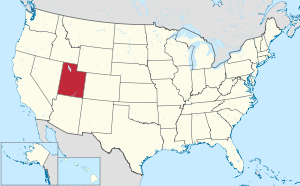
 Utah's location within the U.S. Utah's location within the U.S. | |
| Coordinates: 37°17′N 111°53′W / 37.29°N 111.89°W / 37.29; -111.89 | |
| Country | |
| State | |
| Founded | January 16, 1864 |
| Named for | Thomas L. Kane |
| Seat | Kanab |
| Largest city | Kanab |
| Area | |
| • Total | 4,109 sq mi (10,640 km) |
| • Land | 3,990 sq mi (10,300 km) |
| • Water | 118 sq mi (310 km) 2.9% |
| Population | |
| • Total | 7,667 |
| • Density | 1.9/sq mi (0.72/km) |
| Time zone | UTC−7 (Mountain) |
| • Summer (DST) | UTC−6 (MDT) |
| Congressional district | 2nd |
| Website | kane |

Kane County is a county in the U.S. state of Utah. As of the 2020 United States Census, the population was 7,667. Its county seat and largest city is Kanab.
History
The county was created on January 16, 1864, by the old federal Utah Territory (1850-1896) territorial legislature, with areas partitioned off from earlier Washington County. It was named for Col. Thomas L. Kane (1822-1883), a friend of the Latter Day Saint (Mormons) settlers when they first arrived westward, led by patriarch Brigham Young (1801-1877), in the 1840s and 1850s. The county boundary was readjusted later, first in 1869, when a portion was returned back to Washington County; second in 1880, when San Juan County was partitioned off and created; and third, in 1883, when additional portions were partitioned from Kane and added to Iron and back to Washington counties.
Geography
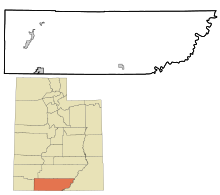
Kane County lies on the south line of the state of Utah. Its south border abuts the northern border of the state of Arizona. The Colorado River, reformed as Lake Powell, forms its eastern border. Grand Staircase–Escalante National Monument covers much of the county. A rugged and inhospitable country of deserts, mountains, and cliffs make up the terrain, with breathtaking scenery in every area. Parts of Bryce Canyon National Park and Zion National Park extend into the northern and western portions of the county. The eastern part of the county is part of the Glen Canyon National Recreation Area. The county has a total area of 4,109 square miles (10,640 km), of which 3,990 square miles (10,300 km) is land and 118 square miles (310 km) (2.9%) is water.
Adjacent counties
- Washington County - west
- Iron County - northwest
- Garfield County - north
- San Juan County - east
- Mohave County, Arizona - southwest
- Coconino County, Arizona - south
Protected areas
- Bryce Canyon National Park (part)
- Coral Pink Sand Dunes State Park
- Dixie National Forest (part)
- Glen Canyon National Recreation Area (part)
- Grand Staircase–Escalante National Monument (part)
- Kodachrome Basin State Park
- Zion National Park (part)
Lakes
Source:
- Lake Powell (along east border)
- Navajo Lake
Demographics
| Census | Pop. | Note | %± |
|---|---|---|---|
| 1870 | 1,513 | — | |
| 1880 | 3,085 | 103.9% | |
| 1890 | 1,685 | −45.4% | |
| 1900 | 1,811 | 7.5% | |
| 1910 | 1,652 | −8.8% | |
| 1920 | 2,054 | 24.3% | |
| 1930 | 2,235 | 8.8% | |
| 1940 | 2,561 | 14.6% | |
| 1950 | 2,299 | −10.2% | |
| 1960 | 2,667 | 16.0% | |
| 1970 | 2,421 | −9.2% | |
| 1980 | 4,024 | 66.2% | |
| 1990 | 5,169 | 28.5% | |
| 2000 | 6,046 | 17.0% | |
| 2010 | 7,125 | 17.8% | |
| 2020 | 7,667 | 7.6% | |
| US Decennial Census 1790–1960 1900–1990 1990–2000 2010 2020 | |||
2020 census
According to the 2020 United States census and 2020 American Community Survey, there were 7,667 people in Kane County with a population density of 1.9 people per square mile (0.7/km). Among non-Hispanic or Latino people, the racial makeup was 6,924 (90.3%) White, 27 (0.4%) African American, 119 (1.6%) Native American, 59 (0.8%) Asian, 1 (0.0%) Pacific Islander, 18 (0.2%) from other races, and 197 (2.6%) from two or more races. 322 (4.2%) people were Hispanic or Latino.
There were 3,808 (49.67%) males and 3,859 (50.33%) females, and the population distribution by age was 1,752 (22.9%) under the age of 18, 3,950 (51.5%) from 18 to 64, and 1,965 (25.6%) who were at least 65 years old. The median age was 44.9 years.
There were 3,081 households in Kane County with an average size of 2.49 of which 1,987 (64.5%) were families and 1,094 (35.5%) were non-families. Among all families, 1,663 (54.0%) were married couples, 110 (3.6%) were male householders with no spouse, and 214 (6.9%) were female householders with no spouse. Among all non-families, 932 (30.2%) were a single person living alone and 162 (5.3%) were two or more people living together. 784 (25.4%) of all households had children under the age of 18. 2,409 (78.2%) of households were owner-occupied while 672 (21.8%) were renter-occupied.
The median income for a Kane County household was $49,486 and the median family income was $69,722, with a per-capita income of $28,142. The median income for males that were full-time employees was $41,368 and for females $34,986. 13.1% of the population and 6.0% of families were below the poverty line.
In terms of education attainment, out of the 5,600 people in Kane County 25 years or older, 480 (8.6%) had not completed high school, 1,391 (24.8%) had a high school diploma or equivalency, 2,066 (36.9%) had some college or associate degree, 1,114 (19.9%) had a bachelor's degree, and 549 (9.8%) had a graduate or professional degree.
Ancestry
The top 5 ethnic groups in Kane County are:
Politics and government
Kane is one of the most reliably Republican counties in the nation. Of "straight-ticket" voters in the 2008 election, there were 992 Republicans and 326 Democrats. In the Utah gubernatorial election, 2004 nearly 70% of the county's vote went for Jon Huntsman, Jr. and in the 2008 election he received around 75% of the vote. Kane County is part of Utah's 2nd congressional district and thus was represented by moderate Democrat Jim Matheson for several years until 2013. The second district is now represented by Republican Celeste Maloy.
In Presidential elections, Kane County has only been won once by a Democratic candidate when Woodrow Wilson carried the county in 1916. It was the only county in Utah carried by Alf Landon, the Republican opponent who lost to Franklin Delano Roosevelt in the 1936 Presidential election in the most lopsided Presidential election in over a century. It has solidly favored the Republican candidate since at least 1956, when Dwight D. Eisenhower received approximately 90% of the vote. In 1964, by over thirty-nine percent, the county went for Barry Goldwater, who lost the overall in the state by over nine percent. Since 1920, only in the Democratic landslides of 1936, 1940, and 1964 did the Democratic candidate for president receive even 30% of the county's vote.
| Position | District | Name | Affiliation | First elected | |
|---|---|---|---|---|---|
| Senate | 24 | Derrin Owens | Republican | 2020 | |
| House of Representatives | 73 | Phil Lyman | Republican | 2018 | |
| Board of Education | 14 | Mark Huntsman | Nonpartisan | 2014 | |
| Year | Republican | Democratic | Third party(ies) | |||
|---|---|---|---|---|---|---|
| No. | % | No. | % | No. | % | |
| 2024 | 3,277 | 72.56% | 1,137 | 25.18% | 102 | 2.26% |
| 2020 | 2,998 | 71.30% | 1,083 | 25.76% | 124 | 2.95% |
| 2016 | 2,265 | 64.02% | 741 | 20.94% | 532 | 15.04% |
| 2012 | 2,522 | 74.81% | 744 | 22.07% | 105 | 3.11% |
| 2008 | 2,212 | 69.65% | 856 | 26.95% | 108 | 3.40% |
| 2004 | 2,414 | 79.12% | 576 | 18.88% | 61 | 2.00% |
| 2000 | 2,254 | 80.44% | 387 | 13.81% | 161 | 5.75% |
| 1996 | 1,682 | 72.63% | 304 | 13.13% | 330 | 14.25% |
| 1992 | 1,241 | 57.14% | 295 | 13.58% | 636 | 29.28% |
| 1988 | 1,788 | 79.29% | 398 | 17.65% | 69 | 3.06% |
| 1984 | 1,710 | 85.12% | 294 | 14.63% | 5 | 0.25% |
| 1980 | 1,492 | 81.35% | 256 | 13.96% | 86 | 4.69% |
| 1976 | 1,094 | 72.50% | 330 | 21.87% | 85 | 5.63% |
| 1972 | 1,146 | 78.82% | 218 | 14.99% | 90 | 6.19% |
| 1968 | 814 | 71.72% | 147 | 12.95% | 174 | 15.33% |
| 1964 | 784 | 69.75% | 340 | 30.25% | 0 | 0.00% |
| 1960 | 876 | 80.44% | 213 | 19.56% | 0 | 0.00% |
| 1956 | 939 | 90.20% | 102 | 9.80% | 0 | 0.00% |
| 1952 | 943 | 85.19% | 164 | 14.81% | 0 | 0.00% |
| 1948 | 769 | 77.76% | 220 | 22.24% | 0 | 0.00% |
| 1944 | 662 | 73.07% | 244 | 26.93% | 0 | 0.00% |
| 1940 | 675 | 66.57% | 339 | 33.43% | 0 | 0.00% |
| 1936 | 519 | 56.54% | 395 | 43.03% | 4 | 0.44% |
| 1932 | 618 | 71.86% | 229 | 26.63% | 13 | 1.51% |
| 1928 | 566 | 79.94% | 141 | 19.92% | 1 | 0.14% |
| 1924 | 515 | 80.22% | 117 | 18.22% | 10 | 1.56% |
| 1920 | 501 | 72.61% | 186 | 26.96% | 3 | 0.43% |
| 1916 | 304 | 46.99% | 329 | 50.85% | 14 | 2.16% |
| 1912 | 426 | 75.27% | 115 | 20.32% | 25 | 4.42% |
| 1908 | 415 | 79.81% | 102 | 19.62% | 3 | 0.58% |
| 1904 | 399 | 79.64% | 102 | 20.36% | 0 | 0.00% |
| 1900 | 392 | 70.89% | 161 | 29.11% | 0 | 0.00% |
| 1896 | 288 | 55.60% | 230 | 44.40% | 0 | 0.00% |
Communities

City
- Kanab (county seat)
Towns
Unincorporated communities
Ghost towns
Education
There is one school district, Kane School District.
Utah State University also has a local campus in Kanab.
See also
References
- Diana's Throne
- "Kane County, Utah". United States Census Bureau. Retrieved June 30, 2023.
- "Find a County". National Association of Counties. Archived from the original on May 31, 2011. Retrieved June 7, 2011.
- Gannett, Henry (1905). The Origin of Certain Place Names in the United States. Govt. Print. Off. p. 172.
- "[[Newberry Library]]. Individual County Chronologies - Kane County UT (accessed March 25, 2019)". Archived from the original on March 6, 2016. Retrieved March 25, 2019.
- ^ Kane County UT Google Maps (accessed 25 March 2019)
- "2010 Census Gazetteer Files". US Census Bureau. August 22, 2012. Retrieved June 25, 2015.
- "US Decennial Census". US Census Bureau. Archived from the original on April 26, 2015. Retrieved June 25, 2015.
- "Historical Census Browser". University of Virginia Library. Retrieved June 25, 2015.
- Forstall, Richard L., ed. (June 25, 1995). "Population of Counties by Decennial Census: 1900 to 1990". US Census Bureau. Retrieved March 27, 2015.
- "Census 2000 PHC-T-4. Ranking Tables for Counties: 1990 and 2000" (PDF). US Census Bureau. April 2, 2001. Retrieved June 25, 2015.
- "State & County QuickFacts". United States Census Bureau. Archived from the original on June 6, 2011. Retrieved December 29, 2013.
- 2020 Population and Housing State Data | Utah
- United States Census Bureau. "2020 Census Demographic and Housing Characteristics File (DHC)". Retrieved November 3, 2024.
- United States Census Bureau. "American Community Survey 5-Year Data (2009-2022)". Retrieved November 3, 2024.
- ^ Leip, David. "Atlas of US Presidential Elections". uselectionatlas.org. Retrieved March 31, 2018.
- "Senator Owens Utah Senate". senate.utah.gov. Retrieved November 16, 2021.
- "Rep. Lyman, Phil". Utah House of Representatives. Retrieved November 15, 2021.
- "Mark Huntsman". www.schools.utah.gov. Retrieved November 15, 2021.
- "2020 CENSUS - SCHOOL DISTRICT REFERENCE MAP: Kane County, UT" (PDF). U.S. Census Bureau. Retrieved September 28, 2024. - Text list
- University, Utah State. "Locations | Statewide Campuses". statewide.usu.edu. Retrieved October 22, 2024.
Further reading
- (1994) "Kane County" article in the Utah History Encyclopedia. The article was written by Miriam B. Murphy and the Encyclopedia was published by the University of Utah Press. ISBN 9780874804256. Archived from the original on May 3, 2024 and retrieved on May 22, 2024.
External links
| Places adjacent to Kane County, Utah | ||||||||||||||||
|---|---|---|---|---|---|---|---|---|---|---|---|---|---|---|---|---|
| ||||||||||||||||
| Municipalities and communities of Kane County, Utah, United States | ||
|---|---|---|
| County seat: Kanab | ||
| City |  | |
| Towns | ||
| Unincorporated communities | ||
| Ghost towns | ||
37°17′N 111°53′W / 37.29°N 111.89°W / 37.29; -111.89
Categories: