Misplaced Pages

List of German cities by GDP

Article snapshot taken from Wikipedia with creative commons attribution-sharealike license. Give it a read and then ask your questions in the chat. We can research this topic together.

The following article sorts the 107 urban districts (Kreisfreie Städte – cities that constitute districts in their own right) and the metropolitan districts of Hanover, Aachen and Saarbrücken by their gross domestic product (GDP) in the year 2021. Most figures are from the Federal Statistical Office of Germany; figures from other sources are otherwise referenced. The GDP of German cities are shown in EUR€.

List of cities

City State GDP
(bil. €)
GDP
per
capita
GDP
per
worker
Berlin  Berlin 165.457 45,074 79,182
Hamburg  Hamburg 130.873 70,620 101,308
Munich  Bavaria 128.752 86,529 112,284
Frankfurt am Main  Hesse 74.087 97,270 100,966
Köln  North Rhine-Westphalia 66.687 61,845 84,983
Hannover region  Lower Saxony 55.374 47,884 80,313
Stuttgart  Baden-Württemberg 54.983 87,513 103,237
Düsseldorf  North Rhine-Westphalia 54.150 87,338 97,282
Nürnberg  Bavaria 32.323 62,997 81,571
Bremen  Bremen 30.973 54,826 83,433
Bonn  North Rhine-Westphalia 27.160 81,997 105,909
Essen  North Rhine-Westphalia 27.114 46,673 79,954
Dortmund  North Rhine-Westphalia 24.595 41,880 73,897
Dresden  Saxony 24.067 43,302 70,771
Leipzig  Saxony 23.804 39,695 67,660
Mainz  Rhineland-Palatinate 22.699 104,441 141,590
Aachen region  North Rhine-Westphalia 22.626 40,647 75,096
Karlsruhe  Baden-Württemberg 22.143 72,016 92,842
Mannheim  Baden-Württemberg 21.491 69,151 89,058
Braunschweig  Lower Saxony 20.504 82,448 122,031
Wolfsburg  Lower Saxony 19.668 158,749 153,485
Wiesbaden  Hesse 19.112 68,556 98,535
Münster  North Rhine-Westphalia 18.800 59,294 78,582
Duisburg  North Rhine-Westphalia 18.360 37,053 78,918
Ingolstadt  Bavaria 17.943 130,509 144,308
Saarbrücken region  Saarland 14.987 45,776 72,215
Bielefeld  North Rhine-Westphalia 14.773 44,263 67,893
Augsburg  Bavaria 14.740 49,771 75,289
Darmstadt  Hesse 14.107 88,497 101,492
Regensburg  Bavaria 13.842 90,529 86,595
Freiburg im Breisgau  Baden-Württemberg 13.712 59,259 75,884
Bochum  North Rhine-Westphalia 13.703 37,650 70,537
Wuppertal  North Rhine-Westphalia 13.502 38,056 77,414
Ludwigshafen am Rhein  Rhineland-Palatinate 13.130 76,182 104,488
Kiel  Schleswig-Holstein 12.452 50,531 70,750
Erlangen  Bavaria 11.814 104,698 104,473
Kassel  Hesse 11.017 54,884 72,133
Ulm  Baden-Württemberg 10.382 81,955 81,228
Lübeck  Schleswig-Holstein 10.231 47,354 76,904
Krefeld  North Rhine-Westphalia 9.803 43,194 78,982
Erfurt  Thuringia 9.483 44,425 66,005
Heidelberg  Baden-Württemberg 9.352 58,819 75,584
Mönchengladbach  North Rhine-Westphalia 9.312 35,770 67,151
Chemnitz  Saxony 9.311 38,199 63,840
Magdeburg  Saxony-Anhalt 8.985 38,074 64,845
Osnabrück  Lower Saxony 8.769 53,267 66,783
Gelsenkirchen  North Rhine-Westphalia 8.763 33,754 76,217
Koblenz  Rhineland-Palatinate 8.729 76,899 80,234
Würzburg  Bavaria 8.653 68,164 67,261
Oldenburg  Lower Saxony 8.558 50,342 71,497
Rostock  Mecklenburg-Vorpommern 8.486 40,656 70,381
Leverkusen  North Rhine-Westphalia 8.419 51,375 103,659
Potsdam  Brandenburg 8.288 45,378 70,536
Halle an der Saale  Saxony-Anhalt 8.149 34,244 64,737
Heilbronn  Baden-Württemberg 7.599 60,292 77,320
Hagen  North Rhine-Westphalia 6.730 35,665 69,761
Mülheim an der Ruhr  North Rhine-Westphalia 6.324 37,019 80,368
Oberhausen  North Rhine-Westphalia 5.908 28,246 64,243
Pforzheim  Baden-Württemberg 5.670 45,080 73,238
Aschaffenburg  Bavaria 5.594 78,658 91,547
Hamm  North Rhine-Westphalia 5.528 30,863 65,705
Solingen  North Rhine-Westphalia 5.448 34,246 74,469
Salzgitter  Lower Saxony 5.369 51,738 94,485
Jena  Thuringia 5.348 48,349 73,015
Schweinfurt  Bavaria 5.299 99,130 82,677
Bamberg  Bavaria 5.138 66,543 67,616
Offenbach am Main  Hesse 5.025 38,328 74,327
Fürth  Bavaria 5.012 38,951 78,836
Kaiserslautern  Rhineland-Palatinate 4.990 50,158 70,040
Trier  Rhineland-Palatinate 4.942 44,678 64,755
Bayreuth  Bavaria 4.795 64,820 72,295
Landshut  Bavaria 4.456 60,954 79,546
Herne  North Rhine-Westphalia 4.350 27,745 66,703
Remscheid  North Rhine-Westphalia 4.319 38,689 71,498
Schwerin  Mecklenburg-Vorpommern 4.224 44,150 64,208
Bremerhaven  Bremen 4.178 36,855 65,679
Coburg  Bavaria 4.031 98,551 98,188
Flensburg  Schleswig-Holstein 3.941 43,541 65,270
Neumünster  Schleswig-Holstein 3.856 48,380 70,620
Cottbus  Brandenburg 3.772 38,284 61,287
Passau  Bavaria 3.717 70,466 68,537
Kempten (Allgäu)  Bavaria 3.711 53,778 72,692
Rosenheim  Bavaria 3.486 54,850 69,983
Worms  Rhineland-Palatinate 3.465 41,419 77,303
Wilhelmshaven  Lower Saxony 3.419 45,522 74,376
Emden  Lower Saxony 3.323 66,872 83,174
Baden-Baden  Baden-Württemberg 3.061 55,158 73,826
Gera  Thuringia 2.946 32,115 60,822
Memmingen  Bavaria 2.883 64,737 74,945
Bottrop  North Rhine-Westphalia 2.882 24,562 62,506
Speyer  Rhineland-Palatinate 2.812 55,513 69,414
Amberg  Bavaria 2.695 64,142 73,043
Straubing  Bavaria 2.690 56,345 65,460
Ansbach  Bavaria 2.630 63,112 70,328
Dessau-Roßlau  Saxony-Anhalt 2.621 33,156 63,961
Weiden in der Oberpfalz  Bavaria 2.521 59,307 62,660
Brandenburg an der Havel  Brandenburg 2.507 34,695 64,392
Frankfurt an der Oder  Brandenburg 2.314 40,710 61,541
Weimar  Thuringia 2.203 33,837 63,978
Landau in der Pfalz  Rhineland-Palatinate 2.166 46,270 63,318
Hof (Saale)  Bavaria 2.087 46,228 61,214
Delmenhorst  Lower Saxony 1.963 25,320 61,135
Frankenthal (Pfalz)  Rhineland-Palatinate 1.885 38,661 74,954
Zweibrücken  Rhineland-Palatinate 1.791 52,606 79,991
Neustadt an der Weinstraße  Rhineland-Palatinate 1.754 32,851 63,965
Kaufbeuren  Bavaria 1.747 38,914 65,558
Eisenach  Thuringia 1.635 39,041 62,559
Pirmasens  Rhineland-Palatinate 1.582 39,428 60,570
Schwabach  Bavaria 1.580 38,430 70,398
Suhl  Thuringia 1.200 35,137 60,076

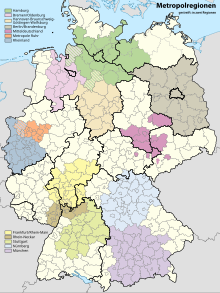
List of metropolitan regions

Metropolitan regions in Germany

The 11 largest metropolitan regions in Germany by their gross domestic product in 2021.

Rank Metropolitan Area GDP (€ Million) (2021) Population (2022) GDP per capita (€)
1 Rhine-Ruhr Metropolitan Region 536,431 13,000,000 41,264
2 Munich Metropolitan Region 361,310 6,300,000 57,349
3 Rhine-Main Metropolitan Region 300,868 5,900,000 50,144
4 Stuttgart Metropolitan Region 275,060 5,300,000 51,896
5 Hamburg Metropolitan Region 249,406 5,100,000 48,902
6 Berlin/Brandenburg Metropolitan Region 246,020 6,300,000 39,048
7 Hannover–Braunschweig–Göttingen–Wolfsburg Metropolitan Region 169,198 3,900,000 43,384
8 Nuremberg Metropolitan Region 156,517 3,500,000 44,719
9 Northwest Metropolitan Region 108,006 2,700,000 40,002
10 Rhine-Neckar Metropolitan Region 105,201 2,400,000 43,834
11 Central German Metropolitan Region 102,532 2,800,000 36,619

See also

References

  1. "Bruttoinlandsprodukt, Bruttowertschöpfung | Statistikportal.de". Statistische Ämter des Bundes und der Länder | Gemeinsames Statistikportal (in German). 2023-07-27. Retrieved 2023-07-31.
  2. "Bruttoinlandsprodukt (BIP) in den Metropolregionen* in Deutschland im Jahr 2021" (in German).
  3. "Einwohner in den Metropolregionen in Deutschland". Statista. Retrieved 2024-11-08.
Categories: