| Litin uezd Литинскій уѣздъ | |
|---|---|
| Uezd | |
 Coat of arms Coat of arms | |
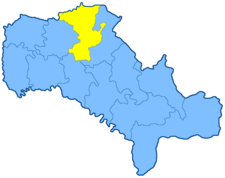
 Location in the Podolia Governorate Location in the Podolia Governorate | |
| Country | Russian Empire |
| Krai | Southwestern |
| Governorate | Podolia |
| Established | 1796 |
| Abolished | 31 January 1923 |
| Capital | Litin |
| Area | |
| • Total | 3,322 km (1,283 sq mi) |
| Population | |
| • Total | 210,502 |
| • Density | 63/km (160/sq mi) |
| • Urban | 11.77% |
| • Rural | 88.23% |
The Litin uezd was a county (uezd) of the Podolian Governorate of the Russian Empire. The uezd bordered the Novograd-Volynsky and Zhitomir uezds of the Volhynian Governorate to the north, the Vinnitsa uezd to the east, the Mogilev uezd to the south, and the Ushitsa uezd to the west. It composed most of Vinnytsia Raion. The administrative centre of the county was Litin (modern-day Lityn).
Administrative divisions
The subcounties (volosts) of the Litin uezd in 1912 were as follows:
| Name | Name in Russian | Capital |
|---|---|---|
| Bagrinovtsy volost | Багриновская волость | Bagrinovtsy |
| Kozhukhov volost | Кожуховская волость | Kozhukhov |
| Mezhirov volost | Межировская волость | Mezhirov |
| Ovsyanniki volost | Овсянникская волость | Ovsyanniki |
| Pilyava volost | Пилявская волость | Pilyava |
| Sosny volost | Сосонская волость | Sosny |
| Staraya-Sinyava volost | Старо-Синявская волость | Staraya-Sinyava |
| Tereshpol volost | Терешпольская волость | Tereshpol |
| Ulanov volost | Улановская волость | Ulanov |
| Khmelnik volost | Хмѣльникская волость | Mazurovka |
Demographics
At the time of the Russian Empire Census on 28 January [O.S. 15 January] 1897, the Litin uezd had a population of 210,502, including 104,182 men and 106,320 women. The majority of the population indicated Little Russian to be their mother tongue, with a significant Jewish speaking minority.
| Language | Native speakers | Percentage |
|---|---|---|
| Little Russian | 175,007 | 83.14 |
| Jewish | 24,051 | 11.43 |
| Great Russian | 6,368 | 3.03 |
| Polish | 4,348 | 2.07 |
| Romanian | 288 | 0.14 |
| German | 105 | 0.05 |
| Gipsy | 99 | 0.05 |
| White Russian | 99 | 0.05 |
| Czech | 61 | 0.03 |
| Tatar | 49 | 0.02 |
| Bashkir | 13 | 0.01 |
| French | 8 | 0.00 |
| Other | 6 | 0.00 |
| Total | 210,502 | 100.00 |
Notes
- ^ Prior to 1918, the Imperial Russian government classified Russians as the Great Russians, Ukrainians as the Little Russians, and Belarusians as the White Russians. After the creation of the Ukrainian People's Republic in 1918, the Little Russians identified themselves as "Ukrainian". Also, the Belarusian Democratic Republic which the White Russians identified themselves as "Belarusian".
References
- Волостныя, станичныя, сельския, гминныя правления и управления, а также полицейские станы всей России с обозначением места их нахождения [Volostny, stanichnaya, rural, communes of government and administration, as well as police camps throughout Russia with the designation of their location]. Kiev: Izd-vo T-va L. M. Fish. 1913. p. 162. Archived from the original on 2022-12-11.
- Hamm, Michael F. (2014). Kiev: A Portrait, 1800–1917. Princeton University Press. p. 83. ISBN 978-1-4008-5151-5.
- Fortson IV, Benjamin W. (2011). Indo-European Language and Culture: An Introduction. John Wiley & Sons. p. 429. ISBN 978-1-4443-5968-8.
- ^ "Демоскоп Weekly - Приложение. Справочник статистических показателей". www.demoscope.ru. Retrieved 2019-12-19.