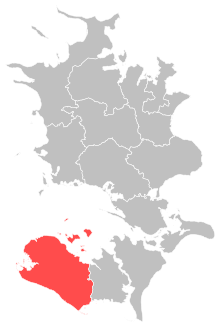
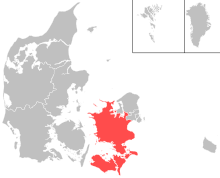
Lolland nominating district is one of the 92 nominating districts that was created for Danish elections following the 2007 municipal reform . It consists of Lolland Municipality .
In general elections , the district is a strong area for parties commonly associated with the red bloc .
General elections results
General elections in the 2020s
2022 Danish general election
General elections in the 2010s
2019 Danish general election
2015 Danish general election
2011 Danish general election
General elections in the 2000s
2007 Danish general election
European Parliament elections results
2024 European Parliament election in Denmark
2019 European Parliament election in Denmark
2014 European Parliament election in Denmark
2009 European Parliament election in Denmark
Referendums
2022 Danish European Union opt-out referendum
Option
Votes
%
✓ YES
11,245
59.17
X NO
7,758
40.83
2015 Danish European Union opt-out referendum
Option
Votes
%
X NO
14,577
63.75
✓ YES
8,289
36.25
2014 Danish Unified Patent Court membership referendum
Option
Votes
%
✓ YES
9,399
57.77
X NO
6,871
42.23
2009 Danish Act of Succession referendum
Option
Votes
%
✓ YES
14,815
82.34
X NO
3,177
17.66
References
"Lollandkredsen" . kmdvalg.dk (in Danish). Retrieved 2023-06-05."Nye valgkredse fordeler stemmerne anderledes" . dr.dk (in Danish). Retrieved 2023-06-05."Beretning om nye valgkredse som følge af kommunalreformen" (in Danish). Retrieved 2023-06-05."Det danske valgsystem: Valg til Folketinget" . valg.im (in Danish). Retrieved 2023-06-05."29 Lolland" . dataforsyningen.dk (in Danish). Retrieved 2023-06-05."Valgresultater fra tidligere valg:" . kmdvalg (in Danish). Retrieved 2023-06-05."FOLKETINGSVALG TIRSDAG 1. NOVEMBER 2022" . valg.im (in Danish). Retrieved 2023-06-27."FOLKETINGSVALG ONSDAG 5. JUNI 2019" . valg.im (in Danish). Retrieved 2023-06-27."FOLKETINGSVALG TORSDAG 18. JUNI 2015" . valg.im (in Danish). Retrieved 2023-06-27."FOLKETINGSVALG TORSDAG 15. SEPTEMBER 2011" . valg.im (in Danish). Retrieved 2023-06-27."Folketingsvalget den 13. november 2007" . valg.im (in Danish). Retrieved 2023-06-27."EUROPA-PARLAMENTSVALG SØNDAG 9. JUNI 2024" . dst.dk (in Danish). Retrieved 2024-06-10."EUROPA-PARLAMENTSVALG SØNDAG 26. MAJ 2019" . dst.dk (in Danish). Retrieved 2023-07-01."EUROPA-PARLAMENTSVALG SØNDAG 25. MAJ 2014" . dst.dk (in Danish). Retrieved 2023-07-01."EUROPA-PARLAMENTSVALG SØNDAG 7. JUNI 2009" . dst.dk (in Danish). Retrieved 2023-07-01."FOLKEAFSTEMNING ONSDAG 1. JUNI 2022" . dst.dk (in Danish). Retrieved 2023-07-05."FOLKEAFSTEMNING TORSDAG 3. DECEMBER 2015" . dst.dk (in Danish). Retrieved 2023-07-05."FOLKEAFSTEMNING SØNDAG 25. MAJ 2014" . dst.dk (in Danish). Retrieved 2023-07-05."FOLKEAFSTEMNING SØNDAG 7. JUNI 2009" . dst.dk (in Danish). Retrieved 2023-07-05.
Category :
Text is available under the Creative Commons Attribution-ShareAlike License. Additional terms may apply.
**DISCLAIMER** We are not affiliated with Wikipedia, and Cloudflare.
The information presented on this site is for general informational purposes only and does not constitute medical advice.
You should always have a personal consultation with a healthcare professional before making changes to your diet, medication, or exercise routine.
AI helps with the correspondence in our chat.
We participate in an affiliate program. If you buy something through a link, we may earn a commission 💕
↑
 Location of Lolland within Zealand
 Location of Zealand within Denmark