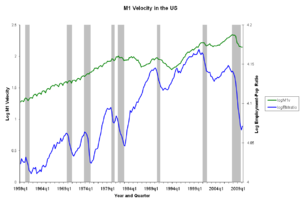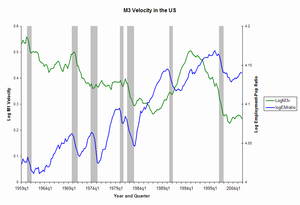


The velocity of money measures the number of times that one unit of currency is used to purchase goods and services within a given time period. In other words, it's how many times money is changing hands. The concept relates the size of economic activity to a given money supply, and the speed of money exchange is one of the variables that determine inflation. The measure of the velocity of money is usually the ratio of the gross national product (GNP) to a country's money supply.
If the velocity of money is increasing, then transactions are occurring between individuals more frequently. The velocity of money changes over time and is influenced by a variety of factors.
Because of the nature of financial transactions, the velocity of money cannot be determined empirically.
Illustration
If, for example, in a very small economy, a farmer and a mechanic, with just $50 between them, buy new goods and services from each other in just three transactions over the course of a year
- A farmer spends $50 on tractor repair from a mechanic.
- The mechanic buys $40 of corn from the farmer.
- The mechanic spends $10 on barn cats from the farmer.
then $100 changed hands in the course of a year, even though there is only $50 in this little economy. That $100 level is possible because each dollar was spent on new goods and services an average of twice a year, which is to say that the velocity was . If the farmer bought a used tractor from the mechanic or made a gift to the mechanic, it would not go into the numerator of velocity because that transaction would not be part of this tiny economy's gross domestic product (GDP).
Relation to money demand
The velocity of money provides another perspective on money demand. Given the nominal flow of transactions using money, if the interest rate on alternative financial assets is high, people will not want to hold much money relative to the quantity of their transactions—they try to exchange it fast for goods or other financial assets, and money is said to "burn a hole in their pocket" and velocity is high. This situation is precisely one of money demand being low. Conversely, with a low opportunity cost, velocity is low and money demand is high. Both situations contribute to the time-varying nature of the money demand. In money market equilibrium, some economic variables (interest rates, income, or the price level) have adjusted to equate money demand and money supply.
The quantitative relation between velocity and money demand is given by Velocity = Nominal Transactions (however defined) divided by Nominal Money Demand.
Indirect measurement
In practice, attempts to measure the velocity of money are usually indirect. The transactions velocity can be computed as
where
- is the velocity of money for all transactions in a given time frame;
- is the price level;
- is the amount of transactions occurring in a given time frame; and
- is the total nominal amount of money in circulation on average in the economy (see “Money supply” for details).
Thus is the total nominal amount of transactions per period.
Values of and permit calculation of .
Similarly, the income velocity of money may be written as
where
- is the velocity for transactions counting towards national or domestic product;
- is an index of real expenditures (on newly produced goods and services); and
- is nominal national or domestic product.
Determination
The determinants and consequent stability of the velocity of money are a subject of controversy across and within schools of economic thought. Those favoring a quantity theory of money have tended to believe that, in the absence of inflationary or deflationary expectations, velocity will be technologically determined and stable, and that such expectations will not generally arise without a signal that overall prices have changed or will change.
This determinant has come under scrutiny in 2020-2021 as the levels of M1 and M2 Money Supply grow at an increasingly volatile rate while Velocity of M1 and M2 flattens to stable new low of a 1.10 ratio. While interest rates have remained stable under the Fed Rate, the economy is saving more M1 and M2 rather than consuming, in the expectations that Fed benchmark interest rate increases from all-time lows of 0.50%. During this time, inflation has risen to new decade highs without the velocity of money.
Criticism
Ludwig von Mises in a 1968 letter to Henry Hazlitt said: "The main deficiency of the velocity of circulation concept is that it does not start from the actions of individuals but looks at the problem from the angle of the whole economic system. This concept in itself is a vicious mode of approaching the problem of prices and purchasing power. It is assumed that, other things being equal, prices must change in proportion to the changes occurring in the total supply of money available. This is not true."
References
Notes
- M2 Definition – Investopedia
- M2 Money Stock – Federal Reserve Bank of St Louis
- ^ "Money Velocity". Federal Reserve Bank of St. Louis. Retrieved October 28, 2013.
- Mishkin, Frederic S. The Economics of Money, Banking, and Financial Markets. Seventh Edition. Addison–Wesley. 2004. p. 520.
- Benchimol, Jonathan; Qureshi, Irfan (2020). "Time-varying money demand and real balance effects" (PDF). Economic Modelling. 87 (1): 197–211. doi:10.1016/j.econmod.2019.07.020.
- Quoted in Hazlitt, Henry. 'Velocity of Circulation' in James Muir Waller (ed.). Money, the market, and the state: economic essays in honor of James Muir Waller. University of Georgia Press, 1968, p. 42.
Sources
- Cramer, J.S. “velocity of circulation”, The New Palgrave: A Dictionary of Economics (1987), v. 4, pp. 601–02.
- Friedman, Milton; “quantity theory of money”, in The New Palgrave: A Dictionary of Economics (1987), v. 4, pp. 3–20.
External links
- Velocity of money data – from the St. Louis Fed's FRED database
 . If the farmer bought a used tractor from the mechanic or made a gift to the mechanic, it would not go into the numerator of velocity because that transaction would not be part of this tiny economy's
 is the velocity of money for all transactions in a given time frame;
 is the
  is the amount of
  is the total nominal amount of
  is the total nominal amount of transactions per period.
 permit calculation of
  .
.

 is the velocity for transactions counting towards
  is an index of
  is nominal