Nuneaton and Bedworth Borough Council elections are held every other year, with half the council being elected each time. Nuneaton and Bedworth Borough Council is the local authority for the non-metropolitan district of Nuneaton and Bedworth in Warwickshire, England. Since the last boundary changes in 2002, 34 councillors have been elected from 17 wards. Prior to 2002 elections were held three years out of every four, with a third of the council elected each time.
Council elections
- 1973 Nuneaton Borough Council election
- 1976 Nuneaton Borough Council election
- 1979 Nuneaton Borough Council election (New ward boundaries)
- 1980 Nuneaton Borough Council election
- 1982 Nuneaton and Bedworth Borough Council election
- 1983 Nuneaton and Bedworth Borough Council election
- 1984 Nuneaton and Bedworth Borough Council election
- 1986 Nuneaton and Bedworth Borough Council election
- 1987 Nuneaton and Bedworth Borough Council election
- 1988 Nuneaton and Bedworth Borough Council election
- 1990 Nuneaton and Bedworth Borough Council election
- 1991 Nuneaton and Bedworth Borough Council election
- 1992 Nuneaton and Bedworth Borough Council election
- 1994 Nuneaton and Bedworth Borough Council election (Borough boundary changes took place but the number of seats remained the same)
- 1995 Nuneaton and Bedworth Borough Council election
- 1996 Nuneaton and Bedworth Borough Council election
- 1998 Nuneaton and Bedworth Borough Council election
- 1999 Nuneaton and Bedworth Borough Council election
- 2000 Nuneaton and Bedworth Borough Council election
- 2002 Nuneaton and Bedworth Borough Council election (New ward boundaries reduced the number of seats by 11)
- 2004 Nuneaton and Bedworth Borough Council election
- 2006 Nuneaton and Bedworth Borough Council election
- 2008 Nuneaton and Bedworth Borough Council election
- 2010 Nuneaton and Bedworth Borough Council election
- 2012 Nuneaton and Bedworth Borough Council election
- 2014 Nuneaton and Bedworth Borough Council election
- 2016 Nuneaton and Bedworth Borough Council election
- 2018 Nuneaton and Bedworth Borough Council election
- 2021 Nuneaton and Bedworth Borough Council election
- 2022 Nuneaton and Bedworth Borough Council election
- 2024 Nuneaton and Bedworth Borough Council election (New ward boundaries increased the number of seats by 4)
Results maps
-
 2002 results map
-
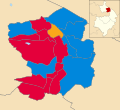 2004 results map
-
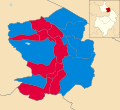 2006 results map
-
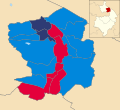 2008 results map
-
 2010 results map
-
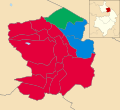 2012 results map
-
 2014 results map
-
 2016 results map
-
 2018 results map
-
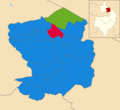 2021 results map
-
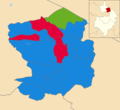 2022 results map
-
 2024 results map
By-election results
1994-1998
| Party | Candidate | Votes | % | ±% | |
|---|---|---|---|---|---|
| Labour | 2,949 | 58.7 | −12.7 | ||
| Conservative | 1,343 | 26.7 | +12.3 | ||
| Liberal Democrats | 735 | 14.6 | +0.4 | ||
| Majority | 1,606 | 32.0 | |||
| Turnout | 5,027 | ||||
| Labour hold | Swing | ||||
2004-2008
| Party | Candidate | Votes | % | ±% | |
|---|---|---|---|---|---|
| Labour | Roma Taylor | 1,507 | 50.8 | +5.4 | |
| Conservative | Sonja Wilson | 846 | 28.5 | +1.4 | |
| Liberal Democrats | Glen Dunton | 615 | 20.7 | +20.7 | |
| Majority | 661 | 22.3 | |||
| Turnout | 2,968 | ||||
| Labour hold | Swing | ||||
| Party | Candidate | Votes | % | ±% | |
|---|---|---|---|---|---|
| Conservative | Marcus Jones | 1,034 | 68.8 | −3,2 | |
| Labour | Jef Hun | 248 | 16.5 | −11.5 | |
| Liberal Democrats | Julie Fox | 220 | 14.6 | +14.6 | |
| Majority | 786 | 52.3 | |||
| Turnout | 1,502 | 26.1 | |||
| Conservative hold | Swing | ||||
| Party | Candidate | Votes | % | ±% | |
|---|---|---|---|---|---|
| Labour | Valerie Richardson | 658 | 37.6 | −17.3 | |
| BNP | Alwyn Deacon | 546 | 31.2 | +31.2 | |
| Conservative | Damon Brown | 301 | 17.2 | −27.9 | |
| Liberal Democrats | Alice Field | 119 | 6.8 | +6.8 | |
| English Democrat | David Lane | 75 | 4.3 | +4.3 | |
| Save Our NHS | Vanessa Casey | 43 | 2.5 | +2.5 | |
| UKIP | Nigel Lanigan | 8 | 0.5 | +0.5 | |
| Majority | 112 | 6.4 | |||
| Turnout | 1,750 | 36.0 | |||
| Labour hold | Swing | ||||
| Party | Candidate | Votes | % | ±% | |
|---|---|---|---|---|---|
| Labour | Jeffrey Hunt | 862 | 40.5 | −2.4 | |
| BNP | Alwyn Deacon | 582 | 27.3 | +27.3 | |
| Conservative | John Ison | 499 | 23.4 | −15.0 | |
| English Democrat | John Lane | 102 | 4.8 | +4.8 | |
| Liberal Democrats | Frank Mills | 83 | 3.9 | −14.8 | |
| Majority | 280 | 13.2 | |||
| Turnout | 2,128 | 40.6 | |||
| Labour gain from Conservative | Swing | ||||
| Party | Candidate | Votes | % | ±% | |
|---|---|---|---|---|---|
| Labour | Jill Sheppard | 807 | 37.9 | −1.0 | |
| BNP | Alwyn Deacon | 457 | 21.5 | +21.5 | |
| Liberal Democrats | Mish Whitmore | 409 | 19.2 | −16.5 | |
| Conservative | Stephen Paxton | 329 | 15.5 | −9.9 | |
| Green | Keith Kondakor | 115 | 5.4 | +5.4 | |
| Independent | Scott Harbison | 10 | 0.5 | +0.5 | |
| Majority | 350 | 16.4 | |||
| Turnout | 2,127 | 38.9 | |||
| Labour gain from Liberal Democrats | Swing | 13.6 | |||
2008-2010
| Party | Candidate | Votes | % | ±% | |
|---|---|---|---|---|---|
| Labour | Ian Lloyd | 670 | 47.1 | +17.0 | |
| BNP | Alwyn Deacon | 478 | 33.6 | −2.6 | |
| Conservative | Kristofer David Wilson | 275 | 19.3 | −9.7 | |
| Majority | 192 | 13.5 | |||
| Turnout | 1,426 | 27.6 | |||
| Labour gain from BNP | Swing | ||||
2010-2014
| Party | Candidate | Votes | % | ±% | |
|---|---|---|---|---|---|
| Labour | Vicky Fowler | 1034 | 51.6 | +6.8 | |
| Conservative | Mike Bannister | 519 | 25.9 | −1.0 | |
| BNP | Alwyn Deacon | 204 | 10.2 | −1.5 | |
| Liberal Democrats | Andrew Crichton | 142 | 7.1 | −8.2 | |
| UKIP | Andreas Hammerschmiedt | 65 | 3.2 | +3.2 | |
| TUSC | Tom Sidwell | 38 | 1.9 | +0.7 | |
| Majority | 515 | 25.7 | |||
| Turnout | 2002 | ||||
| Labour hold | Swing | ||||
| Party | Candidate | Votes | % | ±% | |
|---|---|---|---|---|---|
| Conservative | Jeff Morgan | 395 | 40.34 | ||
| Labour | Tricia Elliott | 369 | 37.69 | ||
| UKIP | Trevor Beard | 109 | 11.13 | ||
| Green | Michael Wright | 55 | 5.61 | ||
| BNP | Alwyn Deacon | 35 | 3.57 | ||
| TUSC | Aidan O'Toole | 8 | 0.81 | ||
| English Democrat | Stephen Paxton | 6 | 0.61 | ||
| Majority | 26 | 2.65 | |||
| Turnout | 979 | ||||
| Conservative gain from Labour | Swing | 13.6% | |||
2014-2018
| Party | Candidate | Votes | % | ±% | |
|---|---|---|---|---|---|
| Conservative | Richard Smith | 1651 | 76 | +40.3 | |
| Labour | Jack Bonner | 517 | 24 | −12 | |
| Majority | 1134 | 52 | |||
| Turnout | 47.1% | ||||
| Conservative gain from Labour | Swing | 27% | |||
2018-2022
| Party | Candidate | Votes | % | ±% | |
|---|---|---|---|---|---|
| Conservative | Jamie Hartshorn | 508 | 55.3 | ||
| Labour | Abi Olaifa | 215 | 23.4 | ||
| Green | Andrew Heritage | 196 | 21.3 | ||
| Majority | 293 | 31.9 | |||
| Turnout | 919 | ||||
| Conservative gain from Labour | Swing | ||||
References
- ^ "The Borough of Nuneaton and Bedworth (Electoral Changes) Order 2000", legislation.gov.uk, The National Archives, SI 2000/2058, retrieved 9 September 2022
- The Borough of Nuneaton (Electoral Arrangements) Order 1977 (S.I. 1977/732)
- legislation.gov.uk - The Warwickshire and West Midlands (County and District Boundaries) Order 1993. Retrieved on 5 November 2015.
- "Nuneaton & Bedworth". BBC News Online. Retrieved 11 December 2009.
- "The Nuneaton & Bedworth (Electoral Changes) Order 2024", legislation.gov.uk, The National Archives, SI 2024/3, retrieved 6 March 2024
- "Tories win by-election". Coventry Telegraph. 11 June 2005. p. 7.
- Evans, Steve (10 February 2007). "Labour shrug off BNP scare ; By-Election: Prospect of first hung council is averted". Coventry Telegraph. p. 9.
- "Labour take ward from Tories". Coventry Telegraph. 30 June 2007. p. 5.
- "Brown digests Labour by-election win". Coventry Telegraph. 22 September 2007.
- ^ "Declaration of Result of Poll" (PDF). Nuneaton and Bedworth Borough Council. 11 December 2009. Retrieved 11 December 2009.
- "Local Elections Archive Project — Bar Pool Ward". www.andrewteale.me.uk. Retrieved 22 April 2022.