| This article needs additional citations for verification. Please help improve this article by adding citations to reliable sources. Unsourced material may be challenged and removed. Find sources: "Deformation" engineering – news · newspapers · books · scholar · JSTOR (September 2008) (Learn how and when to remove this message) |

In engineering, deformation (the change in size or shape of an object) may be elastic or plastic. If the deformation is negligible, the object is said to be rigid.
Main concepts
Occurrence of deformation in engineering applications is based on the following background concepts:
- Displacements are any change in position of a point on the object, including whole-body translations and rotations (rigid transformations).
- Deformation are changes in the relative position between internals points on the object, excluding rigid transformations, causing the body to change shape or size.
- Strain is the relative internal deformation, the dimensionless change in shape of an infinitesimal cube of material relative to a reference configuration. Mechanical strains are caused by mechanical stress, see stress-strain curve.
The relationship between stress and strain is generally linear and reversible up until the yield point and the deformation is elastic. Elasticity in materials occurs when applied stress does not surpass the energy required to break molecular bonds, allowing the material to deform reversibly and return to its original shape once the stress is removed. The linear relationship for a material is known as Young's modulus. Above the yield point, some degree of permanent distortion remains after unloading and is termed plastic deformation. The determination of the stress and strain throughout a solid object is given by the field of strength of materials and for a structure by structural analysis.
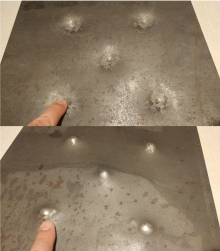
In the above figure, it can be seen that the compressive loading (indicated by the arrow) has caused deformation in the cylinder so that the original shape (dashed lines) has changed (deformed) into one with bulging sides. The sides bulge because the material, although strong enough to not crack or otherwise fail, is not strong enough to support the load without change. As a result, the material is forced out laterally. Internal forces (in this case at right angles to the deformation) resist the applied load.
Types of deformation
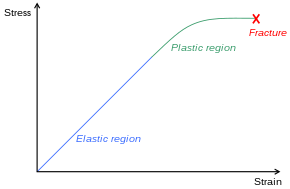
Depending on the type of material, size and geometry of the object, and the forces applied, various types of deformation may result. The image to the right shows the engineering stress vs. strain diagram for a typical ductile material such as steel. Different deformation modes may occur under different conditions, as can be depicted using a deformation mechanism map.
Permanent deformation is irreversible; the deformation stays even after removal of the applied forces, while the temporary deformation is recoverable as it disappears after the removal of applied forces. Temporary deformation is also called elastic deformation, while the permanent deformation is called plastic deformation.

Elastic deformation
Further information: Elasticity (physics)The study of temporary or elastic deformation in the case of engineering strain is applied to materials used in mechanical and structural engineering, such as concrete and steel, which are subjected to very small deformations. Engineering strain is modeled by infinitesimal strain theory, also called small strain theory, small deformation theory, small displacement theory, or small displacement-gradient theory where strains and rotations are both small.
For some materials, e.g. elastomers and polymers, subjected to large deformations, the engineering definition of strain is not applicable, e.g. typical engineering strains greater than 1%, thus other more complex definitions of strain are required, such as stretch, logarithmic strain, Green strain, and Almansi strain. Elastomers and shape memory metals such as Nitinol exhibit large elastic deformation ranges, as does rubber. However, elasticity is nonlinear in these materials.
Normal metals, ceramics and most crystals show linear elasticity and a smaller elastic range.
Linear elastic deformation is governed by Hooke's law, which states:
where
- σ is the applied stress;
- E is a material constant called Young's modulus or elastic modulus;
- ε is the resulting strain.
This relationship only applies in the elastic range and indicates that the slope of the stress vs. strain curve can be used to find Young's modulus (E). Engineers often use this calculation in tensile tests. The area under this elastic region is known as resilience.
Note that not all elastic materials undergo linear elastic deformation; some, such as concrete, gray cast iron, and many polymers, respond in a nonlinear fashion. For these materials Hooke's law is inapplicable.

Plastic deformation

This type of deformation is not undone simply by removing the applied force. An object in the plastic deformation range, however, will first have undergone elastic deformation, which is undone simply be removing the applied force, so the object will return part way to its original shape. Soft thermoplastics have a rather large plastic deformation range as do ductile metals such as copper, silver, and gold. Steel does, too, but not cast iron. Hard thermosetting plastics, rubber, crystals, and ceramics have minimal plastic deformation ranges. An example of a material with a large plastic deformation range is wet chewing gum, which can be stretched to dozens of times its original length.
Under tensile stress, plastic deformation is characterized by a strain hardening region and a necking region and finally, fracture (also called rupture). During strain hardening the material becomes stronger through the movement of atomic dislocations. The necking phase is indicated by a reduction in cross-sectional area of the specimen. Necking begins after the ultimate strength is reached. During necking, the material can no longer withstand the maximum stress and the strain in the specimen rapidly increases. Plastic deformation ends with the fracture of the material.

Failure
Compressive failure
Usually, compressive stress applied to bars, columns, etc. leads to shortening.
Loading a structural element or specimen will increase the compressive stress until it reaches its compressive strength. According to the properties of the material, failure modes are yielding for materials with ductile behavior (most metals, some soils and plastics) or rupturing for brittle behavior (geomaterials, cast iron, glass, etc.).
In long, slender structural elements — such as columns or truss bars — an increase of compressive force F leads to structural failure due to buckling at lower stress than the compressive strength.
Fracture
See also: Concrete fracture analysis and Fracture mechanicsA break occurs after the material has reached the end of the elastic, and then plastic, deformation ranges. At this point forces accumulate until they are sufficient to cause a fracture. All materials will eventually fracture, if sufficient forces are applied.
Types of stress and strain
Engineering stress and engineering strain are approximations to the internal state that may be determined from the external forces and deformations of an object, provided that there is no significant change in size. When there is a significant change in size, the true stress and true strain can be derived from the instantaneous size of the object.
Engineering stress and strain
Consider a bar of original cross sectional area A0 being subjected to equal and opposite forces F pulling at the ends so the bar is under tension. The material is experiencing a stress defined to be the ratio of the force to the cross sectional area of the bar, as well as an axial elongation:
| Stress | Strain |
|---|---|
Subscript 0 denotes the original dimensions of the sample. The SI derived unit for stress is newtons per square metre, or pascals (1 pascal = 1 Pa = 1 N/m), and strain is unitless. The stress–strain curve for this material is plotted by elongating the sample and recording the stress variation with strain until the sample fractures. By convention, the strain is set to the horizontal axis and stress is set to vertical axis. Note that for engineering purposes we often assume the cross-section area of the material does not change during the whole deformation process. This is not true since the actual area will decrease while deforming due to elastic and plastic deformation. The curve based on the original cross-section and gauge length is called the engineering stress–strain curve, while the curve based on the instantaneous cross-section area and length is called the true stress–strain curve. Unless stated otherwise, engineering stress–strain is generally used.
True stress and strain

In the above definitions of engineering stress and strain, two behaviors of materials in tensile tests are ignored:
- the shrinking of section area
- compounding development of elongation
True stress and true strain are defined differently than engineering stress and strain to account for these behaviors. They are given as
| Stress | Strain |
|---|---|
Here the dimensions are instantaneous values. Assuming volume of the sample conserves and deformation happens uniformly,
The true stress and strain can be expressed by engineering stress and strain. For true stress,
For the strain,
Integrate both sides and apply the boundary condition,
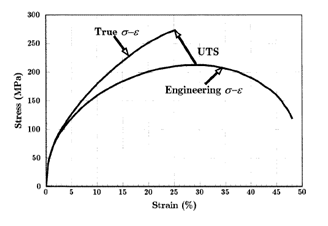
So in a tension test, true stress is larger than engineering stress and true strain is less than engineering strain. Thus, a point defining true stress–strain curve is displaced upwards and to the left to define the equivalent engineering stress–strain curve. The difference between the true and engineering stresses and strains will increase with plastic deformation. At low strains (such as elastic deformation), the differences between the two is negligible. As for the tensile strength point, it is the maximal point in engineering stress–strain curve but is not a special point in true stress–strain curve. Because engineering stress is proportional to the force applied along the sample, the criterion for necking formation can be set as
This analysis suggests nature of the ultimate tensile strength (UTS) point. The work strengthening effect is exactly balanced by the shrinking of section area at UTS point.
After the formation of necking, the sample undergoes heterogeneous deformation, so equations above are not valid. The stress and strain at the necking can be expressed as:
An empirical equation is commonly used to describe the relationship between true stress and true strain.
Here, n is the strain-hardening exponent and K is the strength coefficient. n is a measure of a material's work hardening behavior. Materials with a higher n have a greater resistance to necking. Typically, metals at room temperature have n ranging from 0.02 to 0.5.
Discussion
Since we disregard the change of area during deformation above, the true stress and strain curve should be re-derived. For deriving the stress strain curve, we can assume that the volume change is 0 even if we deformed the materials. We can assume that:
Then, the true stress can be expressed as below:
Additionally, the true strain εT can be expressed as below:
Then, we can express the value as
Thus, we can induce the plot in terms of and as right figure.
Additionally, based on the true stress-strain curve, we can estimate the region where necking starts to happen. Since necking starts to appear after ultimate tensile stress where the maximum force applied, we can express this situation as below:
so this form can be expressed as below:
It indicates that the necking starts to appear where reduction of area becomes much significant compared to the stress change. Then the stress will be localized to specific area where the necking appears.
Additionally, we can induce various relation based on true stress-strain curve.
1) True strain and stress curve can be expressed by the approximate linear relationship by taking a log on true stress and strain. The relation can be expressed as below:
Where is stress coefficient and is strain-hardening coefficient. Usually, the value of has range around 0.02 to 0.5 at room temperature. If is 1, we can express this material as perfect elastic material.
2) In reality, stress is also highly dependent on the rate of strain variation. Thus, we can induce the empirical equation based on the strain rate variation.

Where is constant related to the material flow stress. indicates the derivative of strain by the time, which is also known as strain rate. is the strain-rate sensitivity. Moreover, value of is related to the resistance toward the necking. Usually, the value of is at the range of 0-0.1 at room temperature and as high as 0.8 when the temperature is increased.
By combining the 1) and 2), we can create the ultimate relation as below:
Where is the global constant for relating strain, strain rate and stress.
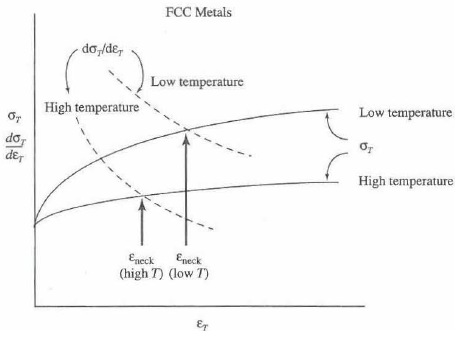
3) Based on the true stress-strain curve and its derivative form, we can estimate the strain necessary to start necking. This can be calculated based on the intersection between true stress-strain curve as shown in right.
This figure also shows the dependency of the necking strain at different temperature. In case of FCC metals, both of the stress-strain curve at its derivative are highly dependent on temperature. Therefore, at higher temperature, necking starts to appear even under lower strain value.
All of these properties indicate the importance of calculating the true stress-strain curve for further analyzing the behavior of materials in sudden environment.
4) A graphical method, so-called "Considere construction", can help determine the behavior of stress-strain curve whether necking or drawing happens on the sample. By setting as determinant, the true stress and strain can be expressed with engineering stress and strain as below:
Therefore, the value of engineering stress can be expressed by the secant line from made by true stress and value where to . By analyzing the shape of diagram and secant line, we can determine whether the materials show drawing or necking.

On the figure (a), there is only concave upward Considere plot. It indicates that there is no yield drop so the material will be suffered from fracture before it yields. On the figure (b), there is specific point where the tangent matches with secant line at point where . After this value, the slope becomes smaller than the secant line where necking starts to appear. On the figure (c), there is point where yielding starts to appear but when , the drawing happens. After drawing, all the material will stretch and eventually show fracture. Between and , the material itself does not stretch but rather, only the neck starts to stretch out.
Misconceptions
A popular misconception is that all materials that bend are "weak" and those that do not are "strong". In reality, many materials that undergo large elastic and plastic deformations, such as steel, are able to absorb stresses that would cause brittle materials, such as glass, with minimal plastic deformation ranges, to break.
See also
- Artificial cranial deformation
- Buff strength
- Creep (deformation)
- Deflection (engineering)
- Deformation (mechanics)
- Deformation mechanism maps
- Deformation monitoring
- Deformation retract
- Deformation theory
- Elasticity
- Malleability
- Planar deformation features
- Plasticity (physics)
- Poisson's ratio
- Strain tensor
- Strength of materials
- Wood warping
References
- Rees, David (2006). Basic Engineering Plasticity: An Introduction with Engineering and Manufacturing Applications. Butterworth-Heinemann. p. 41. ISBN 0-7506-8025-3. Archived from the original on 2017-12-22.
- Callister, William D. (2004) Fundamentals of Materials Science and Engineering, John Wiley and Sons, 2nd ed. p. 184. ISBN 0-471-66081-7.
- Courtney, Thomas (2005). Mechanical behavior of materials. Waveland Press, Inc. pp. 6–13.
- ^ Courtney, Thomas (2000). Mechanical Behavior of Materials. Illinois: Waveland Press. p. 165. ISBN 9780073228242.
- "True Stress and Strain" (PDF). Archived from the original (PDF) on 2018-01-27. Retrieved 2018-05-15.
- Roland, David. "STRESS-STRAIN CURVES" (PDF). MIT.
- Rice, Peter and Dutton, Hugh (1995). Structural glass. Taylor & Francis. p. 33. ISBN 0-419-19940-3.
{{cite book}}: CS1 maint: multiple names: authors list (link)


 and
and  as right figure.


 is stress coefficient and
  is strain-hardening coefficient. Usually, the value of
 is constant related to the material flow stress.
  indicates the derivative of strain by the time, which is also known as strain rate.
  is the strain-rate sensitivity. Moreover, value of
 is the global constant for relating strain, strain rate and stress.
 as determinant, the true stress and strain can be expressed with engineering stress and strain as below:

 value where
  to
to  . By analyzing the shape of
  diagram and secant line, we can determine whether the materials show drawing or necking.
 . After this value, the slope becomes smaller than the secant line where necking starts to appear. On the figure (c), there is point where yielding starts to appear but when
  , the drawing happens. After drawing, all the material will stretch and eventually show fracture. Between
  and
and  , the material itself does not stretch but rather, only the neck starts to stretch out.