| Ramatuelle | |
|---|---|
| Commune | |
 A view of Ramatuelle A view of Ramatuelle | |
 Coat of arms Coat of arms | |
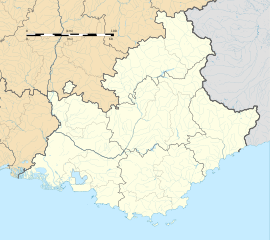
| Location of Ramatuelle | |
  | |
| Coordinates: 43°13′00″N 6°36′43″E / 43.2167°N 6.6119°E / 43.2167; 6.6119 | |
| Country | France |
| Region | Provence-Alpes-Côte d'Azur |
| Department | Var |
| Arrondissement | Draguignan |
| Canton | Sainte-Maxime |
| Government | |
| • Mayor (2020–2026) | Roland Bruno |
| Area | 35.57 km (13.73 sq mi) |
| Population | 1,889 |
| • Density | 53/km (140/sq mi) |
| Time zone | UTC+01:00 (CET) |
| • Summer (DST) | UTC+02:00 (CEST) |
| INSEE/Postal code | 83101 /83350 |
| Elevation | 0–324 m (0–1,063 ft) (avg. 146 m or 479 ft) |
| French Land Register data, which excludes lakes, ponds, glaciers > 1 km (0.386 sq mi or 247 acres) and river estuaries. | |
Ramatuelle (French pronunciation: [ʁamatɥɛl]; Provençal: Ramatuela) is a commune in the southeastern French department of Var.
History
Ramatuelle lies near St-Tropez, Sainte-Maxime and Gassin. It was built on a hill to defend itself against enemies. The town was known in the Middle Ages as Ramatuella (either derived from the tribe of the Camatullici or from the Arabic Rahmatollah i.e. رحمة الله 'the mercy of God') and was part of the area ruled by the Moors of nearby Fraxinet in the ninth and tenth centuries.
Geography
Climate
Ramatuelle has a hot-summer Mediterranean climate (Köppen climate classification Csa). The average annual temperature in Ramatuelle is 16.2 °C (61.2 °F). The average annual rainfall is 696.8 mm (27.43 in) with October as the wettest month. The temperatures are highest on average in August, at around 24.4 °C (75.9 °F), and lowest in January, at around 9.9 °C (49.8 °F). The highest temperature ever recorded in Ramatuelle was 37.3 °C (99.1 °F) on 16 August 2021; the coldest temperature ever recorded was −10.0 °C (14.0 °F) on 10 February 1956.
| Climate data for Ramatuelle (Cape Camarat, altitude 107m, 1981–2010 normals, extremes 1949–present) | |||||||||||||
|---|---|---|---|---|---|---|---|---|---|---|---|---|---|
| Month | Jan | Feb | Mar | Apr | May | Jun | Jul | Aug | Sep | Oct | Nov | Dec | Year |
| Record high °C (°F) | 22.1 (71.8) |
25.7 (78.3) |
26.1 (79.0) |
28.2 (82.8) |
32.0 (89.6) |
34.9 (94.8) |
36.9 (98.4) |
37.3 (99.1) |
33.4 (92.1) |
29.3 (84.7) |
24.8 (76.6) |
23.0 (73.4) |
37.3 (99.1) |
| Mean daily maximum °C (°F) | 12.8 (55.0) |
13.2 (55.8) |
15.3 (59.5) |
17.1 (62.8) |
20.9 (69.6) |
24.6 (76.3) |
28.0 (82.4) |
28.5 (83.3) |
24.9 (76.8) |
20.7 (69.3) |
16.2 (61.2) |
13.5 (56.3) |
19.7 (67.5) |
| Daily mean °C (°F) | 9.8 (49.6) |
9.9 (49.8) |
11.7 (53.1) |
13.6 (56.5) |
17.3 (63.1) |
20.9 (69.6) |
24.1 (75.4) |
24.4 (75.9) |
21.2 (70.2) |
17.6 (63.7) |
13.2 (55.8) |
10.6 (51.1) |
16.2 (61.2) |
| Mean daily minimum °C (°F) | 6.9 (44.4) |
6.6 (43.9) |
8.2 (46.8) |
10.1 (50.2) |
13.8 (56.8) |
17.3 (63.1) |
20.1 (68.2) |
20.4 (68.7) |
17.5 (63.5) |
14.5 (58.1) |
10.3 (50.5) |
7.7 (45.9) |
12.8 (55.0) |
| Record low °C (°F) | −8.0 (17.6) |
−10.0 (14.0) |
−5.4 (22.3) |
0.8 (33.4) |
4.8 (40.6) |
9.0 (48.2) |
13.0 (55.4) |
11.8 (53.2) |
9.0 (48.2) |
2.8 (37.0) |
−2.5 (27.5) |
−2.8 (27.0) |
−10.0 (14.0) |
| Average precipitation mm (inches) | 77.0 (3.03) |
50.0 (1.97) |
45.6 (1.80) |
70.9 (2.79) |
38.9 (1.53) |
31.5 (1.24) |
11.7 (0.46) |
22.8 (0.90) |
61.9 (2.44) |
119.0 (4.69) |
83.8 (3.30) |
83.7 (3.30) |
696.8 (27.43) |
| Average precipitation days (≥ 1.0 mm) | 6.1 | 5.5 | 5.0 | 6.9 | 4.5 | 2.9 | 1.2 | 2.0 | 4.3 | 7.5 | 7.4 | 7.0 | 60.4 |
| Source: Météo-France | |||||||||||||
Population
| Year | Pop. | ±% p.a. |
|---|---|---|
| 1968 | 1,253 | — |
| 1975 | 1,209 | −0.51% |
| 1982 | 1,762 | +5.53% |
| 1990 | 1,945 | +1.24% |
| 1999 | 2,131 | +1.02% |
| 2007 | 2,272 | +0.80% |
| 2012 | 2,126 | −1.32% |
| 2017 | 2,070 | −0.53% |
| Source: INSEE | ||
Notable people
- David Hamilton (British photographer), lived here around 1975-1980
See also
References
- "Répertoire national des élus: les maires" (in French). data.gouv.fr, Plateforme ouverte des données publiques françaises. 13 September 2022.
- "Populations de référence 2022" (in French). The National Institute of Statistics and Economic Studies. 19 December 2024.
- P. Sénac, "Contribution a l'étude des incursions Musulmanes dans l'Occident Chrétien: la localisation du Ğabal al-Qilāl" Revue de l'Occident Musulman et de la Méditerranée, 31 (1981) 7–14.
- "Fiche Climatologique Statistiques 1981-2010 et records" (PDF) (in French). Météo-France. Retrieved September 8, 2022.
- Population en historique depuis 1968, INSEE
External links
This Var geographical article is a stub. You can help Misplaced Pages by expanding it. |


