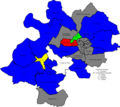
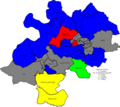
Stroud District Council in Gloucestershire, England is elected every four years. The all-out elections every four years began in 2016; up to and including the 2015 election one third of the council was elected each year, followed by one year without election.
Council elections
- 1973 Stroud District Council election
- 1976 Stroud District Council election
- 1979 Stroud District Council election
- 1983 Stroud District Council election (New ward boundaries)
- 1984 Stroud District Council election
- 1986 Stroud District Council election
- 1987 Stroud District Council election
- 1988 Stroud District Council election
- 1990 Stroud District Council election
- 1991 Stroud District Council election (New ward boundaries & district boundary changes also took place)
- 1992 Stroud District Council election
- 1994 Stroud District Council election
- 1995 Stroud District Council election
- 1996 Stroud District Council election
- 1998 Stroud District Council election
- 1999 Stroud District Council election
- 2000 Stroud District Council election
- 2002 Stroud District Council election (New ward boundaries reduced the number of seats by 4)
- 2003 Stroud District Council election
- 2004 Stroud District Council election
- 2006 Stroud District Council election
- 2007 Stroud District Council election
- 2008 Stroud District Council election (Some new ward boundaries)
- 2010 Stroud District Council election
- 2011 Stroud District Council election
- 2012 Stroud District Council election
- 2014 Stroud District Council election
- 2015 Stroud District Council election
- 2016 Stroud District Council election (New ward boundaries)
- 2021 Stroud District Council election
- 2024 Stroud District Council election
District result maps
-
 2006 results map
-
 2007 results map
-
 2008 results map
-
 2010 results map
-
 2016 results map
-
 2021 results map
-
 2024 results map
By-election results
1994-1998
| Party | Candidate | Votes | % | ±% | |
|---|---|---|---|---|---|
| Labour | 308 | 55.2 | |||
| Liberal Democrats | 250 | 44.8 | |||
| Majority | 58 | 10.4 | |||
| Turnout | 558 | ||||
| Labour gain from Liberal Democrats | Swing | ||||
| Party | Candidate | Votes | % | ±% | |
|---|---|---|---|---|---|
| Labour | 857 | 55.8 | |||
| Liberal Democrats | 272 | 17.7 | |||
| Conservative | 240 | 15.6 | |||
| Green | 167 | 10.8 | |||
| Majority | 585 | 381 | |||
| Turnout | 1,536 | ||||
| Labour hold | Swing | ||||
1998-2002
| Party | Candidate | Votes | % | ±% | |
|---|---|---|---|---|---|
| Conservative | 275 | 60.3 | +35.5 | ||
| Liberal Democrats | 159 | 34.9 | −19.7 | ||
| Labour | 22 | 4.8 | −15.8 | ||
| Majority | 116 | 25.4 | |||
| Turnout | 456 | 46.0 | |||
| Conservative gain from Liberal Democrats | Swing | ||||
| Party | Candidate | Votes | % | ±% | |
|---|---|---|---|---|---|
| Liberal Democrats | 1,319 | 35.4 | +9.5 | ||
| Conservative | 1,308 | 35.1 | +4.0 | ||
| Labour | 1,163 | 29.6 | +5.6 | ||
| Majority | 11 | 0.3 | |||
| Turnout | 3,790 | 67.8 | |||
| Liberal Democrats hold | Swing | ||||
2002-2006
| Party | Candidate | Votes | % | ±% | |
|---|---|---|---|---|---|
| Conservative | Tim Frankau | 652 | 39.7 | +3.2 | |
| Liberal Democrats | Brian Marsh | 609 | 37.1 | +8.1 | |
| Labour | Paul Denney | 382 | 23.2 | −11.3 | |
| Majority | 43 | 2.6 | |||
| Turnout | 1,643 | 35.8 | |||
| Conservative hold | Swing | ||||
| Party | Candidate | Votes | % | ±% | |
|---|---|---|---|---|---|
| Labour | Andrew Treacher | 652 | 43.4 | +4.7 | |
| Conservative | Linda Jeffreys | 425 | 28.3 | +0.0 | |
| Liberal Democrats | John Bowen | 257 | 17.1 | −4.1 | |
| Green | Helen Royall | 169 | 11.2 | −0.6 | |
| Majority | 227 | 15.1 | |||
| Turnout | 1,503 | 28.9 | |||
| Labour hold | Swing | ||||
2006-2010
| Party | Candidate | Votes | % | ±% | |
|---|---|---|---|---|---|
| Labour | Thomas Williams | 489 | 43.1 | +6.9 | |
| Conservative | Linda Jeffreys | 407 | 35.9 | +3.1 | |
| Liberal Democrats | Darren Jones | 238 | 21.0 | +8.5 | |
| Majority | 82 | 7.2 | |||
| Turnout | 1,134 | 22.1 | |||
| Labour hold | Swing | ||||
| Party | Candidate | Votes | % | ±% | |
|---|---|---|---|---|---|
| Conservative | Rowland Blackwell | 857 | 44.5 | +6.1 | |
| Green | Chris Harmer | 810 | 42.0 | +4.1 | |
| Labour | Jo Smith | 261 | 13.5 | +0.2 | |
| Majority | 47 | 2.5 | |||
| Turnout | 1,928 | 38.0 | |||
| Conservative hold | Swing | ||||
2010-2014
| Party | Candidate | Votes | % | ±% | |
|---|---|---|---|---|---|
| Conservative | Margaret Wigzell | 366 | 54.9 | +0.5 | |
| Labour | Audrey Smith | 177 | 26.5 | +10.8 | |
| Liberal Democrats | Adrian Walker-Smith | 124 | 18.6 | +6.8 | |
| Majority | 189 | 28.3 | |||
| Turnout | 667 | 38.8 | |||
| Conservative hold | Swing | ||||
| Party | Candidate | Votes | % | ±% | |
|---|---|---|---|---|---|
| Labour | Miranda Clifton | 654 | 53.2 | +6.0 | |
| Conservative | Loraine Patrick | 575 | 46.8 | −6.0 | |
| Majority | 79 | 6.4 | |||
| Turnout | 1,229 | ||||
| Labour gain from Conservative | Swing | ||||
2014-2016
| Party | Candidate | Votes | % | ±% | |
|---|---|---|---|---|---|
| Green | Martin Baxendale | 291 | 42.8 | −4.3 | |
| Labour | James Heslop | 230 | 33.8 | +2.3 | |
| UKIP | Stuart Love | 76 | 11.2 | +11.2 | |
| Conservative | Stephen Davies | 67 | 9.9 | −11.5 | |
| TUSC | Lucy Roberts | 16 | 2.4 | +2.4 | |
| Majority | 61 | 9.0 | |||
| Turnout | 680 | ||||
| Green hold | Swing | ||||
2016-2021
| Party | Candidate | Votes | % | ±% | |
|---|---|---|---|---|---|
| Conservative | Darren Loftus | 751 | 45.1 | +12.9 | |
| Labour | Karen Pitney | 427 | 25.6 | −2.0 | |
| Green | Robin Lewis | 341 | 20.5 | −7.5 | |
| Liberal Democrats | Kris Beacham | 146 | 8.8 | +8.8 | |
| Majority | 324 | 19.5 | |||
| Turnout | 1,665 | ||||
| Conservative hold | Swing | ||||
| Party | Candidate | Votes | % | ±% | |
|---|---|---|---|---|---|
| Labour | Trevor Hall | 889 | 50.5 | +13.5 | |
| Conservative | Loraine Patrick | 704 | 40.0 | +15.3 | |
| Green | Yvon Dignon | 90 | 5.1 | −9.1 | |
| Liberal Democrats | Richard Blackwell-Whitehead | 79 | 4.5 | −19.5 | |
| Majority | 185 | 10.5 | |||
| Turnout | 1,762 | ||||
| Labour hold | Swing | ||||
| Party | Candidate | Votes | % | ±% | |
|---|---|---|---|---|---|
| Conservative | Lindsay Green | 993 | 49.8 | +4.6 | |
| Labour | Liz Ashton | 686 | 34.4 | +0.8 | |
| Liberal Democrats | Mike Stayte | 231 | 11.6 | −1.5 | |
| Green | Thomas Willetts | 82 | 4.1 | −3.9 | |
| Majority | 307 | 15.4 | |||
| Turnout | 1,992 | ||||
| Conservative hold | Swing | ||||
2021-2024
| Party | Candidate | Votes | % | ±% | |
|---|---|---|---|---|---|
| Green | Gary Luff | 1,168 | 45.9 | +11.9 | |
| Conservative | Sue Williams | 817 | 32.1 | −10.3 | |
| Liberal Democrats | Roz Savage | 381 | 15.0 | +15.0 | |
| Labour | Ela Pathak-Sen | 180 | 7.1 | −16.5 | |
| Majority | 351 | 13.8 | |||
| Turnout | 2,546 | ||||
| Green gain from Conservative | Swing | ||||
References
- legislation.gov.uk - The District of Stroud (Electoral Arrangements) Order 1979. Retrieved on 19 November 2015.
- legislation.gov.uk - The Gloucestershire Districts (Electoral Arrangements) Order 1991. Retrieved on 4 November 2015.
- legislation.gov.uk - The Gloucestershire Districts (Electoral Arrangements) (Variation) Order 1991. Retrieved on 4 November 2015.
- legislation.gov.uk - The Avon and Gloucestershire (County Boundaries) Order 1991. Retrieved on 5 November 2015.
- legislation.gov.uk - The Gloucestershire (District Boundaries) Order 1991. Retrieved on 6 November 2015.
- "Stroud". BBC News Online. Retrieved 10 September 2009.
- legislation.gov.uk - The District of Stroud (Parishes and Electoral Changes) Order 2001. Retrieved on 4 October 2015.
- legislation.gov.uk - The District of Stroud (Parishes and Electoral Changes) (Amendment) Order 2005. Retrieved on 3 November 2015.
- legislation.gov.uk - The Stroud (Parish Electoral Arrangements and Electoral Changes) Order 2008. Retrieved on 3 November 2015.
- legislation.gov.uk - The Stroud (Electoral Changes) Order 2015. Retrieved on 20 April 2016.
- "Results of Cainscross District Ward By-Election 2005". Stroud District Council. Retrieved 6 January 2011.
- "Results of Cainscross District Ward By-Election". Stroud District Council. Retrieved 6 January 2011.
- "Nailsworth By Elections 2007". Stroud District Council. Retrieved 10 September 2009.
- Mead, Chris (4 February 2011). "Labour celebrates council by-election breakthrough". The Independent. Retrieved 4 February 2011.
- "Declaration of result of poll" (PDF). Stroud District Council. Retrieved 4 February 2011.
- "Local Elections Archive Project — Cam East Ward". www.andrewteale.me.uk. Retrieved 11 March 2024.
- "Local Elections Archive Project — Valley Ward". www.andrewteale.me.uk. Retrieved 11 March 2024.
- "Local Elections Archive Project — Chalford Ward". www.andrewteale.me.uk. Retrieved 11 March 2024.
- "Local Elections Archive Project — Chalford Ward". www.andrewteale.me.uk. Retrieved 11 March 2024.
- "Local Elections Archive Project — Berkeley Vale Ward". www.andrewteale.me.uk. Retrieved 11 March 2024.
- "Local Elections Archive Project — Painswick and Upton Ward". www.andrewteale.me.uk. Retrieved 11 March 2024.