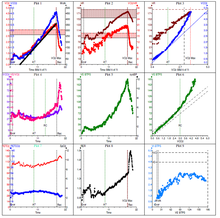
The Wasserman 9-Panel Plot, often called a Nine-Panel Plot, is a standard layout for the graphical representation of data produced by a cardiopulmonary exercise test. The layout was updated in 2012. The graphs give an overview of cardiovascular, ventilatory, and gas exchange parameters.
Eponym
The Wasserman 9-Panel Plot is named for American physiologist Professor Karlman Wasserman M.D. Ph.D., who first displayed the data in this manner. Professor Wasserman worked extensively on pulmonary physiology, and also described the "gear wheel model" used for explaining results obtained from the test.
References
- Agnew, Neil (2010-04-01). "Preoperative cardiopulmonary exercise testing". Continuing Education in Anaesthesia, Critical Care & Pain. 10 (2): 33–37. doi:10.1093/bjaceaccp/mkq001. ISSN 1743-1816.
- "Cardiopulmonary Exercise Testing" (PDF). CareFusion.
- Sun, Xing-Guo (July 2015). "". Zhongguo Ying Yong Sheng Li Xue Za Zhi = Zhongguo Yingyong Shenglixue Zazhi = Chinese Journal of Applied Physiology. 31 (4): 369–373. ISSN 1000-6834. PMID 26775513.
This medical diagnostic article is a stub. You can help Misplaced Pages by expanding it. |