| Revision as of 20:05, 4 October 2024 editVinnylospo (talk | contribs)Extended confirmed users14,439 edits →External links← Previous edit |
Latest revision as of 00:58, 8 January 2025 edit undoThomascampbell123 (talk | contribs)Extended confirmed users28,612 edits →Recent results in statewide elections: Added results for current district. |
| (5 intermediate revisions by 4 users not shown) |
| Line 3: |
Line 3: |
|
{{Use mdy dates|date=April 2021}} |
|
{{Use mdy dates|date=April 2021}} |
|
{{Infobox U.S. congressional district |
|
{{Infobox U.S. congressional district |
|
|state = Georgia |
|
| state = Georgia |
|
|district number = 10 |
|
| district number = 10 |
|
⚫ |
| image name = {{maplink|frame=yes|plain=yes|from=Georgia's 10th congressional district (2025–).map|frame-height=300|frame-width=400|frame-latitude=33.7|frame-longitude=-83.3|zoom=8|overlay-horizontal-alignment=right|overlay-vertical-alignment=bottom|overlay=]}} |
|
|image name = {{switcher |
|
|
|
| image width = |
|
|{{maplink|frame=yes|plain=yes|from=Georgia's 10th congressional district (2023–).map|frame-height=300|frame-width=400|frame-latitude=33.67|frame-longitude=-83.3|zoom=8|overlay-horizontal-alignment=right|overlay-vertical-alignment=bottom|overlay=]}} |
|
|
⚫ |
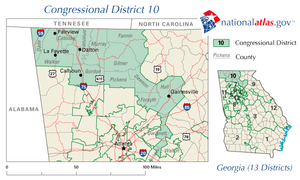
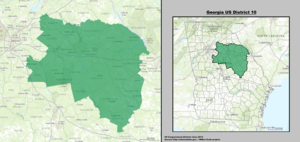
| image caption = Interactive map of district boundaries since January 3, 2025 |
|
|From 2023 to 2025 |
|
|
⚫ |
| representative = ] |
| ⚫ |
|{{maplink|frame=yes|plain=yes|from=Georgia's 10th congressional district (2025–).map|frame-height=300|frame-width=400|frame-latitude=33.7|frame-longitude=-83.3|zoom=8|overlay-horizontal-alignment=right|overlay-vertical-alignment=bottom|overlay=]}} |
|
|
⚫ |
| party = Republican |
|
|From 2025 |
|
|
⚫ |
| residence = Jackson |
|
}} |
|
|
|image width = |
|
| english area = |
|
⚫ |
| metric area = |
| ⚫ |
|image caption = Interactive map of district boundaries |
|
|
⚫ |
| distribution ref = <ref>{{cite web |url=https://www.census.gov/geo/maps-data/data/cd_state.html |url-status=dead |archive-url=https://web.archive.org/web/20130402141525/http://www.census.gov/geo/maps-data/data/cd_state.html |archive-date=April 2, 2013 |title=Congressional Districts Relationship Files (State-based) - Geography - U.S. Census Bureau}}</ref> |
| ⚫ |
|representative = ] |
|
|
⚫ |
| percent urban = 56.03 |
| ⚫ |
|party = Republican |
|
|
|
| percent rural = 43.97 |
| ⚫ |
|residence = Jackson |
|
|
⚫ |
| population = 833,978<ref>{{Cite web|url=https://www.census.gov/mycd/?st=13&cd=10|title = My Congressional District}}</ref> |
|
|english area = |
|
|
⚫ |
| population year = 2023 |
| ⚫ |
|metric area = |
|
|
⚫ |
| median income = $72,143<ref>{{Cite web|url=https://www.census.gov/mycd/?st=13&cd=10|title = My Congressional District}}</ref> |
| ⚫ |
|distribution ref=<ref>{{cite web |url=https://www.census.gov/geo/maps-data/data/cd_state.html |url-status=dead |archive-url=https://web.archive.org/web/20130402141525/http://www.census.gov/geo/maps-data/data/cd_state.html |archive-date=April 2, 2013 |title=Congressional Districts Relationship Files (State-based) - Geography - U.S. Census Bureau}}</ref> |
|
|
|percent urban = 56.03 |
|
| percent white = 63.6 |
|
|percent rural = 43.97 |
|
| percent hispanic = 7.7 |
|
|
| percent black = 22.1 |
| ⚫ |
|population = 833,978<ref>{{Cite web|url=https://www.census.gov/mycd/?st=13&cd=10|title = My Congressional District}}</ref> |
|
|
⚫ |
| percent asian = 2.3 |
| ⚫ |
|population year = 2023 |
|
|
⚫ |
| percent more than one race = 3.6 |
| ⚫ |
|median income = $72,143<ref>{{Cite web|url=https://www.census.gov/mycd/?st=13&cd=10|title = My Congressional District}}</ref> |
|
|
| percent white = 63.6 |
|
| percent other race = 0.7 |
|
| percent hispanic = 7.7 |
|
| percent blue collar = |
|
| percent black = 22.1 |
|
| percent white collar = |
|
| percent asian = 2.3 |
|
| percent gray collar = |
|
⚫ |
| cpvi = R+15<ref name=Cook>{{Cite web|title=2022 Cook PVI: District Map and List|url=https://www.cookpolitical.com/cook-pvi/2022-partisan-voting-index/district-map-and-list|access-date=2023-01-10|website=Cook Political Report|date=July 12, 2022 |language=en}}</ref> |
| ⚫ |
| percent more than one race = 3.6 |
|
| ⚫ |
| percent other race = 0.7 |
|
| ⚫ |
|percent blue collar = |
|
|
|percent white collar = |
|
|
|percent gray collar = |
|
| ⚫ |
|cpvi = R+15<ref name=Cook>{{Cite web|title=2022 Cook PVI: District Map and List|url=https://www.cookpolitical.com/cook-pvi/2022-partisan-voting-index/district-map-and-list|access-date=2023-01-10|website=Cook Political Report|date=July 12, 2022 |language=en}}</ref> |
|
|
}} |
|
}} |
|
|
|
|
| Line 169: |
Line 164: |
|
* ] – 2,541 |
|
* ] – 2,541 |
|
|
|
|
|
== Recent results in statewide elections == |
|
== Recent election results from statewide races == |
|
|
|
|
{| class=wikitable |
|
{| class=wikitable |
| ⚫ |
|- |
|
|
! Year |
|
! Year |
|
! Office |
|
! Office |
|
|
! Results<ref>https://davesredistricting.org/maps#viewmap::e2864750-49da-49dd-b0a4-f5930c339af1</ref> |
|
! Results |
|
|
⚫ |
|- |
|
⚫ |
||2008 |
|
⚫ |
| ] |
|
⚫ |
| align="right" {{party shading/Republican}}|] 61% - 38% |
|
|
|- |
|
⚫ |
||2012 |
|
⚫ |
| ] |
|
⚫ |
| align="right" {{party shading/Republican}}|] 64% - 36% |
|
|
|- |
|
|
|rowspan=2|2016 |
|
⚫ |
| ] |
|
⚫ |
| align="right" {{party shading/Republican}}|] 62% - 35% |
|
|
|- |
|
⚫ |
| ] |
|
⚫ |
| align="right" {{party shading/Republican}}|] 64% - 31% |
|
|
|- |
|
|
|rowspan=3|2018 |
|
|
| ] |
|
|
| align="right" {{party shading/Republican}}|] 62% - 37% |
|
|
|- |
|
|
| ] |
|
|
| align="right" {{party shading/Republican}}|] 63% - 37% |
|
|
|- |
|
|
| ] |
|
|
| align="right" {{party shading/Republican}}|] 63% - 37% |
|
|
|- |
|
⚫ |
||2020 |
|
|
| ] |
|
|
| align="right" {{party shading/Republican}}|] 60% - 39% |
|
|- |
|
|- |
|
|
|rowspan=2|2021 |
|
| 2000 |
|
|
| ] |
|
| ] |
|
| align="left" {{party shading/Republican}}|] 63% - ] 37% |
|
| align="right" {{party shading/Republican}}|] 60% - 40% |
|
|- |
|
|- |
|
|
| ] |
|
| 2004 |
|
|
|
| align="right" {{party shading/Republican}}|] 60% - 40% |
| ⚫ |
| ] |
|
| ⚫ |
| align="left" {{party shading/Republican}}|] 65% - ] 35% |
|
|
|- |
|
|- |
|
|
|rowspan=5|2022 |
| ⚫ |
| 2008 |
|
|
| ] |
|
| ] |
|
| align="left" {{party shading/Republican}}|] 60.4% - ] 38.8% |
|
| align="right" {{party shading/Republican}}|] 59% - 39% |
|
|- |
|
|- |
|
|
| ] |
| ⚫ |
| 2012 |
|
|
|
| align="right" {{party shading/Republican}}|] 64% - 36% |
| ⚫ |
| ] |
|
| ⚫ |
| align="left" {{party shading/Republican}}|] 62.5% - ] 36.3% |
|
|
|- |
|
|- |
|
|
| ] |
|
| 2016 |
|
|
|
| align="right" {{party shading/Republican}}|] 62% - 36% |
| ⚫ |
| ] |
|
| ⚫ |
| align="left" {{party shading/Republican}}|] 61.3% - ] 35.8% |
|
|
|- |
|
|- |
|
|
| ] |
| ⚫ |
| 2020 |
|
|
|
| align="right" {{party shading/Republican}}|] 62% - 37% |
| ⚫ |
| ] |
|
| ⚫ |
| align="left" {{party shading/Republican}}|] 60% - ] 39% |
|
|
|- |
|
|- |
|
|
| ] |
|
|
| align="right" {{party shading/Republican}}|] 63% - 34% |
|
|} |
|
|} |
|
|
|
|
| Line 390: |
Line 410: |
|
| rowspan=2 align=left | ] <br />''']'''<br>{{small|(])}} |
|
| rowspan=2 align=left | ] <br />''']'''<br>{{small|(])}} |
|
| rowspan=2 {{party shading/Republican}} | ] |
|
| rowspan=2 {{party shading/Republican}} | ] |
|
| rowspan=2 nowrap | January 3, 2023 –<br />present |
|
| rowspan=2 nowrap | January 7, 2023 –<br />present |
|
| rowspan=2 | {{USCongressOrdinal|118|Present}} |
|
| rowspan=2 | {{USCongressOrdinal|118|Present}} |
|
| rowspan=2 | ]. |
|
| rowspan=2 | ].<br/>]. |
|
| '''2023–2025'''<br/>] |
|
| '''2023–2025'''<br/>] |
|
|
|
|
 Interactive map of district boundaries since January 3, 2025


