| Revision as of 08:14, 4 July 2024 edit2601:205:4686:6950:d826:3207:d348:aef8 (talk) Punjabi 38.78 not 44Tags: Reverted Visual edit Mobile edit Mobile web edit← Previous edit | Revision as of 08:24, 4 July 2024 edit undoArjayay (talk | contribs)Autopatrolled, Extended confirmed users, Page movers, Pending changes reviewers, Rollbackers629,077 editsm Undid revision 1232542894 by 2601:205:4686:6950:D826:3207:D348:AEF8 (talk) Rv to figure in cited sourceTag: UndoNext edit → | ||
| Line 2,334: | Line 2,334: | ||
| |caption = Ethnic groups in Pakistan (])<ref>{{Citation |title=Pakistan |url=https://www.cia.gov/the-world-factbook/countries/pakistan/ |work=The World Factbook |date=26 May 2022 |publisher=Central Intelligence Agency}}</ref> | |caption = Ethnic groups in Pakistan (])<ref>{{Citation |title=Pakistan |url=https://www.cia.gov/the-world-factbook/countries/pakistan/ |work=The World Factbook |date=26 May 2022 |publisher=Central Intelligence Agency}}</ref> | ||
| |label1 = ] | |label1 = ] | ||
| |value1 = |
|value1 = 44.7 | ||
| |color1 = Green | |color1 = Green | ||
| |label2 = ] | |label2 = ] | ||
Revision as of 08:24, 4 July 2024
This article is about the demographic features of the population of Pakistan. For a general overview of the citizens of Pakistan, see Pakistanis.
| Demographics of Pakistan | |
|---|---|
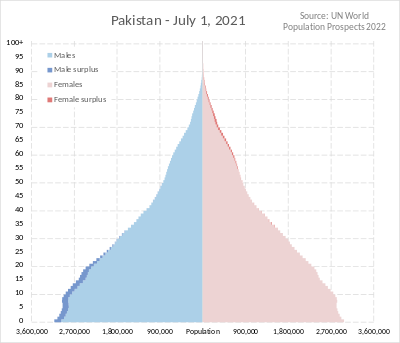 Population pyramid of Pakistan as of July 1, 2021 Population pyramid of Pakistan as of July 1, 2021 | |
| Population | 241,492,197 (2023 census) |
| Density | 260.8/km (675/sq mi) 248.9/km (645/sq mi) (including AJK and GB) |
| Growth rate | |
| Birth rate | 22.5 births / 1,000 population (2023 est.) |
| Death rate | 7.2 deaths / 1,000 population (2021 est.) |
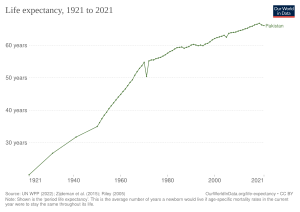
| Life expectancy | 69.1 years (2022 est.) |
| • male | 66.8 years (2022 est.) |
| • female | 71.6 years (2022 est.) |
| Fertility rate | 3.47 children born / woman (2021 est.) |
| Net migration rate | −2.0 migrants / 1,000 population (2021 est.) |
| Age structure | |
| 0–14 years | 40.3% (2017) |
| 15–64 years | 56.0% (2017) |
| 65 and over | 3.7% (2017) |
| Nationality | |
| Nationality | noun: Pakistani |
| Major ethnic | See Ethnic groups of Pakistan |
| Language | |
| Spoken | See Languages of Pakistan |
Pakistan had a population of 241,492,197 according to the final results of the 2023 Census. This figure includes Pakistan's four provinces e.g. Punjab, Sindh, KPK, Balochistan and Islamabad Capital Territory. AJK and Gilgit-Baltistan's census data is yet to be approved by CCI Council of Pakistan. Pakistan is the world's fifth most populous country.
Between 1951 and 2017, Pakistan's population expanded over sixfold, going from 33.7 million to 207.7 million. The country has a relatively high, although declining, growth rate supported by high birth rates and low death rates. Between 1998 and 2017, the average annual population growth rate stood at +2.40%.
Dramatic social changes have led to urbanization and the emergence of two megacities: Karachi and Lahore. The country's urban population more than tripled between 1981 and 2017 (from 23.8 million to 75.7 million), as Pakistan's urbanisation rate rose from 28.2% to 36.4%. Even with this, the nation's urbanisation rate remains one of the lowest in the world, and in 2017, over 130 million Pakistanis (making up nearly 65% of the population) lived in rural areas.
Due to a high fertility rate, which was estimated at 3.5 in 2022, Pakistan has one of the world's youngest populations. The 2017 census recorded that 40.3% of the country's population was under the age of 15, while only 3.7% of Pakistanis were aged 65 or more. The median age of the country was 19, while its sex ratio was recorded to be 105 males per 100 females.
The demographic history of Pakistan from the ancient Indus Valley civilization to the modern era includes the arrival and settlement of many cultures and ethnic groups in the modern region of Pakistan from Eurasia and the nearby Middle East. Because of this, Pakistan has a multicultural, multilinguistic, and multiethnic society. Despite Urdu being Pakistan's lingua franca, estimates on how many languages are spoken in the country range from 75 to 85, and in 2017, the country's three largest ethnolinguistic groups were the Punjabis (making up 38.8% of the total population), the Pashtuns (18.2%), and the Sindhis (14.6%). Pakistan is also thought to have the world's fourth-largest refugee population, estimated at 1.4 million in mid-2021 by the UNHCR.
Population
Main article: Census in Pakistan| Year | Pop. | ±% p.a. |
|---|---|---|
| 1951 | 33,740,167 | — |
| 1961 | 42,880,378 | +2.43% |
| 1972 | 65,309,340 | +3.90% |
| 1981 | 84,253,644 | +2.87% |
| 1998 | 132,352,279 | +2.69% |
| 2017 | 207,684,626 | +2.40% |
| 2023 | 241,492,917 | +2.55% |
| Source: | ||
The 2017 census recorded a population of 207,684,626 living in Pakistan's four provinces and the Islamabad Capital Territory. The census also reported that Azad Kashmir's population stood at 4,045,367 and Gilgit-Baltistan's population was 1,492,924. This meant that the total population of Pakistan in 2017 was 213,222,917.
The statistics in the graphs below were created by the United Nations in July 2022, and are covered in more detail in the following section. This data includes Azad Kashmir and Gilgit-Baltistan.For years, the country with a population exceeding 230 million has been grappling to achieve economic stability. The people of Pakistan are living in a precarious situation, with an uncertain future in the country.
| Graphs are unavailable due to technical issues. Updates on reimplementing the Graph extension, which will be known as the Chart extension, can be found on Phabricator and on MediaWiki.org. |
| Graphs are unavailable due to technical issues. Updates on reimplementing the Graph extension, which will be known as the Chart extension, can be found on Phabricator and on MediaWiki.org. |
| Graphs are unavailable due to technical issues. Updates on reimplementing the Graph extension, which will be known as the Chart extension, can be found on Phabricator and on MediaWiki.org. |
| Graphs are unavailable due to technical issues. Updates on reimplementing the Graph extension, which will be known as the Chart extension, can be found on Phabricator and on MediaWiki.org. |
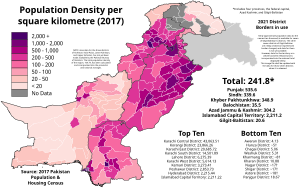
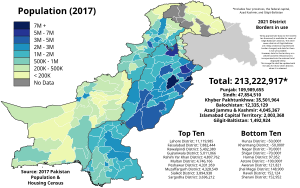
Estimates from the United Nations
In July 2022, the United Nations published its 2022 World Population Prospects, a bi annually-updated database where key demographic indicators are estimated and projected worldwide down to the country level. They prepared estimates of Pakistan's population for every year from 1950 to 2021, as well as projections for future decades. This data includes Azad Kashmir and Gilgit-Baltistan.
Projections are highlighted in light yellow, and future figures are taken from the medium fertility variant.
| Year | Population | % Population aged 0 to 14 |
% Population aged 15 to 64 |
% Population aged 65 or more |
|---|---|---|---|---|
| 1950 | 37,696,264 | 40.5% | 54.0% | 5.5% |
| 1955 | 40.3% | 55.3% | 4.4% | |
| 1960 | 45,954,226 | 40.6% | 55.6% | 3.7% |
| 1965 | 51,841,626 | 42.3% | 54.4% | 3.4% |
| 1970 | 59,290,872 | 43.7% | 53.0% | 3.3% |
| 1975 | 68,126,999 | 43.9% | 52.8% | 3.4% |
| 1980 | 80,624,057 | 43.0% | 53.5% | 3.4% |
| 1985 | 97,121,552 | 43.0% | 53.5% | 3.5% |
| 1990 | 115,414,069 | 43.7% | 52.8% | 3.5% |
| 1995 | 133,117,476 | 44.4% | 52.1% | 3.5% |
| 2000 | 154,369,924 | 42.9% | 53.6% | 3.5% |
| 2005 | 174,372,098 | 41.1% | 55.4% | 3.5% |
| 2010 | 194,454,498 | 39.2% | 57.0% | 3.7% |
| 2015 | 210,969,298 | 38.4% | 57.7% | 3.9% |
| 2020 | 227,196,741 | 37.3% | 58.6% | 4.2% |
| 2025 | 249,948,885 | 35.3% | 60.2% | 4.5% |
| 2030 | 274,029,836 | 33.2% | 61.9% | 4.9% |
| 2035 | 298,432,780 | 31.7% | 63.1% | 5.2% |
| 2040 | 322,595,767 | 29.5% | 64.8% | 5.7% |
| 2045 | 345,818,945 | 28.1% | 65.8% | 6.2% |
| 2050 | 367,808,468 | 26.6% | 66.5% | 6.9% |
Structure of population

The table below shows Pakistan's population structure by five-year age group and sex using data from the 2017 census. The country's population structure is relatively young, with a median age of 19. With low death rates and a declining birth rate, the country is in the third stage of its Demographic transition. In 2017, Pakistan's sex ratio stood at 105 males per 100 females, which is much more balanced than South Asia as a whole.
The statistics below do not contain Azad Kashmir or Gilgit-Baltistan, which disseminate their census data separately from Pakistan's four provinces and Islamabad.
| Age Group | Male | Female | Total | Sex ratio | Percent |
|---|---|---|---|---|---|
| Total | 106,318,22 | 101,344,632 | 207,684,626 | 104.9 | 100.0% |
| 0 – 4 | 14,944,124 | 14,218,866 | 29,162,990 | 105.1 | 14.0% |
| 5 – 9 | 15,642,725 | 14,383,593 | 30,026,318 | 108.8 | 14.5% |
| 10 – 14 | 12,946,871 | 11,580,317 | 24,527,188 | 111.8 | 11.8% |
| 15 – 19 | 11,095,138 | 10,269,213 | 21,366,618 | 108.0 | 10.3% |
| 20 – 24 | 9,245,010 | 9,247,936 | 18,495,895 | 100.0 | 8.9% |
| 25 – 29 | 7,936,382 | 8,461,628 | 16,401,132 | 93.8 | 7.9% |
| 30 – 34 | 6,945,532 | 7,203,496 | 14,151,748 | 96.4 | 6.8% |
| 35 – 39 | 6,088,144 | 5,958,164 | 12,048,811 | 102.2 | 5.8% |
| 40 – 44 | 4,847,522 | 4,777,667 | 9,627,067 | 101.5 | 4.6% |
| 45 – 49 | 4,060,698 | 3,869,277 | 7,931,616 | 104.9 | 3.8% |
| 50 – 54 | 3,643,706 | 3,300,645 | 6,945,580 | 110.4 | 3.3% |
| 55 – 59 | 2,647,127 | 2,326,991 | 4,974,986 | 113.8 | 2.4% |
| 60 – 64 | 2,247,341 | 2,063,695 | 4,311,861 | 108.9 | 2.1% |
| 65 – 69 | 1,557,733 | 1,393,718 | 2,952,013 | 111.8 | 1.4% |
| 70 – 74 | 1,131,916 | 1,001,805 | 2,134,220 | 113.0 | 1.0% |
| 75 or more | 1,338,251 | 1,287,621 | 2,626,523 | 103.9 | 1.26% |
| Age Group | Male | Female | Total | Sex ratio | Percent |
| 0 – 14 | 43,533,720 | 40,182,776 | 83 716 496 | 108.3 | 40.3% |
| 15 – 64 | 58,778,374 | 57,478,712 | 116,257,086 | 102.3 | 56.0% |
| 65+ | 4,027,900 | 3,683,144 | 7,711,044 | 109.4 | 3.7% |
Population distribution
Pakistan's population is distributed unevenly, with over half of the country's people living in the Punjab province. On the other hand, Balochistan, which is geographically Pakistan's largest province, is its least-populated. The population is mainly clustered around the most agriculturally fertile areas, particularly the Indus River and its tributaries. Most of the country's people live in rural areas, but two large and growing megacities exist: the coastal Karachi and Lahore in eastern Punjab. Numerous smaller cities (such as Faisalabad, Rawalpindi, Peshawar, and the capital Islamabad) dot the rest of the country.
By province
The table below shows Pakistan's provinces and territories by their historical population. While every one of Pakistan's administrative units currently has a growing population, the pace of growth is uneven throughout the country due to differing levels of fertility, mortality, as well as domestic and international migration. Populations pertaining to the modern borders of provinces are shown.
| Province or Territory | 1951 | 1961 | 1972 | 1981 | 1998 | 2017 |
|---|---|---|---|---|---|---|
| 20,540,762 | 25,463,974 | 37,607,423 | 47,292,441 | 73,691,290 | 109,989,655 | |
| 6,047,748 | 8,367,065 | 14,155,909 | 19,028,666 | 30,439,893 | 47,854,510 | |
| 5,888,550 | 7,578,186 | 10,879,781 | 13,259,875 | 20,919,976 | 35,501,964 | |
| 1,167,167 | 1,353,484 | 2,428,678 | 4,332,376 | 6,565,885 | 12,335,129 | |
| — | 117,669 | 237,549 | 340,286 | 805,235 | 2,003,368 | |
| Four Provinces and ICT | 33,740,167 | 42,880,378 | 65,309,340 | 84,253,644 | 132,352,279 | 207,684,626 |
| 886,000 | 1,065,000 | 1,573,000 | 1,983,465 | 2,972,501 | 4,045,367 | |
| — | — | — | — | 884,000 | 1,492,924 | |
| Total Pakistan | — | — | — | — | 136,208,780 | 213,222,917 |
Urbanization
The following table shows how Pakistan has urbanised. As is true with population growth, urbanisation is an uneven and nonlinear process. With an urbanisation rate of 51.9% as of 2017, Sindh is the country's most urbanised province, and is even more urban than Islamabad Capital Territory. This is largely fuelled by the growth of Karachi, which economically dominates the province and attracts migrants from the rest of the country. On the other hand, the northwestern province of Khyber Pakhtunkhwa and the territory of Gilgit-Baltistan both share very low urbanisation rates of 16.5%.
| Province or Territory | 1951 | 1961 | 1972 | 1981 | 1998 | 2017 |
|---|---|---|---|---|---|---|
| 17.3% | 21.5% | 24.4% | 27.6% | 31.3% | 36.9% | |
| 29.2% | 37.9% | 40.4% | 43.3% | 48.8% | 51.9% | |
| 8.6% | 10.3% | 11.1% | 12.6% | 14.3% | 16.5% | |
| 12.4% | 16.9% | 16.5% | 15.6% | 23.9% | 27.6% | |
| 0.0% | 0.0% | 32.3% | 60.1% | 65.7% | 50.4% | |
| Four Provinces and ICT | 17.7% | 22.5% | 25.4% | 28.3% | 32.5% | 36.4% |
| — | — | — | 8.1% | 12.5% | 17.4% | |
| — | — | — | — | 16.8% | 16.5% | |
| 0.0% | 0.0% | 32.3% | 60.1% | 65.7% | 50.4% |
Largest cities
Main article: List of cities in Pakistan by populationAs urbanisation has progressed and owing to the country's large population, Pakistan today has many very large urban centers which act as hubs for commerce and culture. The nation has two megacities, Karachi and Lahore. With populations of 14.9 million and 11.1 million respectively (in 2017), they are among the world's largest metropolises. The country also has seven more cities with more than 1 million residents each: Faisalabad, Rawalpindi, Gujranwala, Peshawar, Multan, Hyderabad, and Islamabad. All of them play a significant role in the country, housing nearly 14 million people altogether. Aside from these, there are 103 more cities in the country with populations of at least 100,000.
Below a list showing Pakistan's twenty largest cities as of the 2017 census can be found, which not only shows the current populations of the cities, but also their growth rates and locations. The full list can be found on the main article: List of cities in Pakistan by population.
All city population figures below include adjacent cantonments.
| City Name | Province or Territory | 2017 Population | 1998 Population | Avg. Annual Growth Rate |
|---|---|---|---|---|
| Karachi | 14,884,402 | 9,339,023 | ||
| Lahore | 11,119,985 | 5,209,088 | ||
| Faisalabad | 3,210,158 | 2,008,861 | ||
| Rawalpindi | 2,097,824 | 1,409,768 | ||
| Gujranwala | 2,028,421 | 1,132,509 | ||
| Peshawar | 1,969,823 | 982,816 | ||
| Multan | 1,872,641 | 1,197,384 | ||
| Hyderabad | 1,733,622 | 1,166,894 | ||
| Islamabad | 1,009,003 | 529,180 | ||
| Quetta | 999,385 | 565,137 | ||
| Bahawalpur | 762,774 | 408,395 | ||
| Sargodha | 658,208 | 458,440 | ||
| Sialkot | 656,730 | 421,502 | ||
| Sukkur | 500,401 | 335,551 | ||
| Larkana | 488,006 | 270,283 | ||
| Sheikhupura | 472,269 | 280,263 | ||
| Rahim Yar Khan | 420,963 | 233,537 | ||
| Jhang | 414,309 | 293,366 | ||
| Dera Ghazi Khan | 397,362 | 190,542 | ||
| Gujrat | 390,758 | 251,792 |
Vital statistics
As Pakistan lacks a national vital statistics system that publicly disseminates data, all of the following information is made from estimates, which are constantly being revised. The United Nations estimated that in February 2021, only 42% of births in Pakistan were officially registered, making it the world's most populous country where more than half of births remained unregistered. The United Nations was unable to estimate how many deaths were officially registered.
Estimates based on surveys
Surveys taken by the Pakistani government or intergovernmental organisations are seen as the most reliable method of keeping tabs on birth, death, fertility, and infant mortality rates in a country without a reliable vital registration system. The data recorded in these surveys is used by the United Nations in order to estimate historical and future fertility and mortality figures for Pakistan in the World Population Prospects.
| Survey | Crude birth rate | Crude death rate | Infant mortality rate | Total fertility rate | Life expectancy | |||
|---|---|---|---|---|---|---|---|---|
| Urban | Rural | Total | Male | Female | ||||
| DHS 2006–07 | 30.7 | — | 78 | 3.30 | 4.49 | 4.08 | — | — |
| PSLM 2007–08 | — | — | 69 | 3.13 | 4.41 | 3.95 | — | — |
| PSLM 2011–12 | — | — | 63 | 3.26 | 4.35 | 3.95 | — | — |
| DHS 2012–13 | — | — | 74 | 3.16 | 4.20 | 3.84 | — | — |
| PSLM 2013–14 | — | — | 65 | 3.24 | 4.35 | 3.95 | — | — |
| DHS 2017–18 | 29 | — | 62 | 2.93 | 3.94 | 3.56 | — | — |
| PSLM 2018–19 | — | — | 60 | 3.01 | 4.21 | 3.75 | — | — |
| PMMS 2019 | — | — | — | — | — | — | 64.3 | 66.5 |
| PDS 2020 | 27 | 6.7 | 56 | 3.07 | 4.11 | 3.72 | 64.5 | 65.5 |
Regional fertility rates
Many of the surveys above also recorded fertility rate data broken down by each of Pakistan's administrative units, while many more surveys have been taken explicitly focusing on a specific province or territory. The fertility rate data recorded in these surveys is displayed in the table below.
| Survey | Punjab | Sindh | KPK | Balochistan | ICT | AJK | G-B | Pakistan |
|---|---|---|---|---|---|---|---|---|
| DHS 2006–07 | 3.9 | 4.3 | 4.3 | 4.1 | — | — | — | 4.08 |
| MICS Punjab 2011 | 3.6 | — | — | — | — | — | — | — |
| DHS 2012–13 | 3.8 | 3.9 | 3.9 | 4.2 | 3.0 | — | 3.8 | 3.84 |
| MICS Punjab 2014 | 3.5 | — | — | — | — | — | — | — |
| MICS Sindh 2014 | — | 4.0 | — | — | — | — | — | — |
| MICS KPK 2016–17 | — | — | 4.0 | — | — | — | — | — |
| MICS G-B 2016–17 | — | — | — | — | — | — | 4.6 | — |
| DHS 2017–18 | 3.4 | 3.6 | 4.1 | 4.0 | 3.0 | 3.5 | 4.7 | 3.56 |
| MICS Punjab 2017–18 | 3.7 | — | — | — | — | — | — | — |
| MICS Sindh 2018–19 | — | 3.7 | — | — | — | — | — | — |
| MICS KPK 2019 | — | — | 4.0 | — | — | — | — | — |
| MICS Balochistan 2019-20 | — | — | — | 4.0 | — | — | — | — |
| MICS AJK 2020–21 | — | — | — | — | — | 3.4 | — | — |
The MICS surveys above also provide data on the district level, although they come with a far higher margin of error. This margin of error is lessened for larger districts from where larger sample sizes were utilised. In the chart below, the latest fertility rate data for each Pakistani district with a population of over 2 million as of the 2017 census can be found. Although the table is originally ranked by district population size, clicking the headers will allow the reader to sort the table.
| District | Province | Total fertility rate | Margin of error | Year of survey | 2017 Population |
|---|---|---|---|---|---|
| Lahore | 3.1 | ±0.2 | 2017–18 | 11,119,985 | |
| Faisalabad | 3.3 | ±0.2 | 2017–18 | 7,882,444 | |
| Rawalpindi | 3.2 | ±0.2 | 2017–18 | 5,402,380 | |
| Gujranwala | 3.4 | ±0.2 | 2017–18 | 5,011,066 | |
| Rahim Yar Khan | 4.6 | ±0.4 | 2017–18 | 4,807,762 | |
| Multan | 3.6 | ±0.3 | 2017–18 | 4,746,166 | |
| Peshawar | 4.0 | ±0.5 | 2019 | 4,331,959 | |
| Muzaffargarh | 4.7 | ±0.3 | 2017–18 | 4,328,549 | |
| Karachi West | 2.2 | ±0.3 | 2018–19 | 3,907,065 | |
| Sialkot | 3.5 | ±0.3 | 2017–18 | 3,894,938 | |
| Sargodha | 3.6 | ±0.3 | 2017–18 | 3,696,212 | |
| Bahawalpur | 3.9 | ±0.4 | 2017–18 | 3,669,176 | |
| Sheikhupura | 3.7 | ±0.3 | 2017–18 | 3,460,004 | |
| Qasur | 4.3 | ±0.3 | 2017–18 | 3,454,881 | |
| Okara | 4.3 | ±0.4 | 2017–18 | 3,040,826 | |
| Bahawalnagar | 3.7 | ±0.3 | 2017–18 | 2,975,656 | |
| Karachi Central | 2.2 | ±0.3 | 2018–19 | 2,971,382 | |
| Khanewal | 4.0 | ±0.4 | 2017–18 | 2,920,233 | |
| Vehari | 3.8 | ±0.3 | 2017–18 | 2,902,081 | |
| Karachi East | 3.2 | ±0.4 | 2018–19 | 2,875,315 | |
| Dera Ghazi Khan | 5.4 | ±0.5 | 2017–18 | 2,872,631 | |
| Gujrat | 3.1 | ±0.2 | 2017–18 | 2,756,289 | |
| Jhang | 4.3 | ±0.4 | 2017–18 | 2,742,633 | |
| Korangi | 2.5 | ±0.3 | 2018–19 | 2,577,556 | |
| Sahiwal | 3.6 | ±0.4 | 2017–18 | 2,513,011 | |
| Khairpur | 4.8 | ±0.8 | 2018–19 | 2,405,190 | |
| Mardan | 4.0 | ±0.3 | 2019 | 2,373,399 | |
| Swat | 4.5 | ±0.5 | 2019 | 2,308,624 | |
| Quetta | 4.7 | ±0.3 | 2019-20 | 2,269,473 | |
| Hyderabad | 3.0 | ±0.4 | 2018–19 | 2,199,928 | |
| Toba Tek Singh | 3.5 | ±0.3 | 2017–18 | 2,191,495 | |
| Sanghar | 4.2 | ±0.4 | 2018–19 | 2,049,873 | |
| Islamabad | 3.0 | ±0.3 | 2017–18 | 2,003,368 |
Estimates from the United Nations
In July 2022, the United Nations published its 2022 World Population Prospects, a biennially-updated database where key demographic indicators are estimated and projected worldwide down to the country level. They prepared the following estimates of demographic indicators in Pakistan for every year from 1950 to 2021, as well as projections for future decades. This data includes Azad Kashmir and Gilgit-Baltistan.
| Year | Mid-year population |
Annual live births |
Annual deaths |
Annual natural increase |
CBR | CDR | RNC | IMR | TFR | Life expectancy | |
|---|---|---|---|---|---|---|---|---|---|---|---|
| Male | Female | ||||||||||
| 1950 | 37,696,264 | 1,647,739 | 1,173,219 | 474,520 | 43.7 | 31.1 | 12.6 | 263.4 | 6.80 | 36.2 | 33.4 |
| 1951 | 38,215,785 | 1,686,378 | 1,121,858 | 564,520 | 44.1 | 29.4 | 14.8 | 252.9 | 6.80 | 37.5 | 34.6 |
| 1952 | 38,816,777 | 1,727,288 | 1,089,817 | 637,471 | 44.5 | 28.1 | 16.4 | 243.3 | 6.80 | 38.6 | 35.8 |
| 1953 | 39,488,228 | 1,768,524 | 1,063,098 | 705,426 | 44.8 | 26.9 | 17.9 | 234.1 | 6.80 | 39.8 | 36.9 |
| 1954 | 40,224,090 | 1,810,574 | 1,044,277 | 766,297 | 45.0 | 26.0 | 19.0 | 225.6 | 6.80 | 40.7 | 37.9 |
| 1955 | 41,023,128 | 1,853,944 | 1,022,153 | 831,791 | 45.2 | 24.9 | 20.3 | 217.4 | 6.80 | 41.8 | 39.0 |
| 1956 | 41,884,995 | 1,900,510 | 1,008,574 | 891,936 | 45.4 | 24.1 | 21.3 | 209.6 | 6.80 | 42.7 | 39.8 |
| 1957 | 42,808,511 | 1,948,801 | 993,703 | 955,098 | 45.5 | 23.2 | 22.3 | 202.2 | 6.80 | 43.7 | 40.7 |
| 1958 | 43,794,993 | 1,999,584 | 981,704 | 1,017,880 | 45.6 | 22.4 | 23.2 | 195.2 | 6.80 | 44.6 | 41.6 |
| 1959 | 44,843,639 | 2,049,555 | 970,149 | 1,079,406 | 45.7 | 21.6 | 24.1 | 188.7 | 6.80 | 45.5 | 42.5 |
| 1960 | 45,954,226 | 2,102,786 | 961,020 | 1,141,766 | 45.7 | 20.9 | 24.8 | 182.6 | 6.80 | 46.3 | 43.4 |
| 1961 | 47,060,915 | 2,157,005 | 951,411 | 1,205,594 | 45.8 | 20.2 | 25.6 | 176.7 | 6.80 | 47.2 | 44.2 |
| 1962 | 48,161,841 | 2,201,790 | 939,942 | 1,261,848 | 45.6 | 19.5 | 26.2 | 171.2 | 6.80 | 48.0 | 45.0 |
| 1963 | 49,325,050 | 2,247,761 | 922,383 | 1,325,378 | 45.5 | 18.7 | 26.8 | 166.0 | 6.80 | 48.8 | 46.3 |
| 1964 | 50,552,592 | 2,293,167 | 907,551 | 1,385,616 | 45.3 | 17.9 | 27.4 | 161.2 | 6.80 | 49.7 | 47.4 |
| 1965 | 51,841,626 | 2,340,733 | 897,333 | 1,443,400 | 45.1 | 17.3 | 27.8 | 157.5 | 6.80 | 50.3 | 48.5 |
| 1966 | 53,199,414 | 2,388,085 | 869,523 | 1,518,562 | 44.8 | 16.3 | 28.5 | 153.2 | 6.80 | 51.6 | 50.0 |
| 1967 | 54,629,793 | 2,438,389 | 854,112 | 1,584,277 | 44.6 | 15.6 | 29.0 | 149.9 | 6.80 | 52.6 | 51.2 |
| 1968 | 56,124,743 | 2,483,692 | 840,624 | 1,643,068 | 44.2 | 15.0 | 29.2 | 147.0 | 6.80 | 53.5 | 52.3 |
| 1969 | 57,676,805 | 2,524,648 | 831,202 | 1,693,446 | 43.7 | 14.4 | 29.3 | 144.5 | 6.80 | 54.2 | 53.3 |
| 1970 | 59,290,872 | 2,584,996 | 818,806 | 1,766,190 | 43.5 | 13.8 | 29.8 | 142.1 | 6.80 | 55.0 | 54.6 |
| 1971 | 60,878,781 | 2,648,206 | 985,142 | 1,663,064 | 43.4 | 16.2 | 27.3 | 145.5 | 6.80 | 49.0 | 52.2 |
| 1972 | 62,509,565 | 2,712,779 | 838,978 | 1,873,801 | 43.3 | 13.4 | 29.9 | 137.9 | 6.81 | 55.4 | 55.1 |
| 1973 | 64,285,624 | 2,785,335 | 852,459 | 1,932,876 | 43.3 | 13.2 | 30.0 | 136.0 | 6.81 | 55.5 | 55.5 |
| 1974 | 66,149,169 | 2,853,960 | 874,080 | 1,979,880 | 43.1 | 13.2 | 29.9 | 134.3 | 6.81 | 55.4 | 55.6 |
| 1975 | 68,126,999 | 2,931,237 | 882,423 | 2,048,814 | 43.0 | 13.0 | 30.1 | 132.5 | 6.81 | 55.8 | 56.2 |
| 1976 | 70,230,923 | 3,015,342 | 900,018 | 2,115,324 | 42.9 | 12.8 | 30.1 | 131.0 | 6.81 | 55.9 | 56.5 |
| 1977 | 72,451,105 | 3,116,181 | 922,294 | 2,193,887 | 43.0 | 12.7 | 30.3 | 129.6 | 6.80 | 55.8 | 56.9 |
| 1978 | 74,789,330 | 3,223,019 | 934,553 | 2,288,466 | 43.1 | 12.5 | 30.6 | 128.1 | 6.78 | 56.3 | 57.4 |
| 1979 | 77,407,341 | 3,337,688 | 950,235 | 2,387,453 | 43.2 | 12.3 | 30.9 | 126.6 | 6.76 | 56.5 | 58.1 |
| 1980 | 80,624,057 | 3,487,787 | 970,044 | 2,517,743 | 43.5 | 12.1 | 31.4 | 125.1 | 6.73 | 56.8 | 58.6 |
| 1981 | 84,270,202 | 3,700,274 | 1,001,060 | 2,699,214 | 44.2 | 11.9 | 32.2 | 123.6 | 6.70 | 57.1 | 59.3 |
| 1982 | 87,828,198 | 3,903,191 | 1,035,663 | 2,867,528 | 44.6 | 11.8 | 32.7 | 122.1 | 6.67 | 57.4 | 59.8 |
| 1983 | 91,080,372 | 4,067,866 | 1,057,064 | 3,010,802 | 44.7 | 11.6 | 33.1 | 120.5 | 6.64 | 57.7 | 60.5 |
| 1984 | 94,003,867 | 4,188,905 | 1,075,240 | 3,113,665 | 44.5 | 11.4 | 33.1 | 118.8 | 6.62 | 58.0 | 61.0 |
| 1985 | 97,121,552 | 4,291,612 | 1,100,992 | 3,190,620 | 44.2 | 11.4 | 32.9 | 117.0 | 6.59 | 58.5 | 60.4 |
| 1986 | 100,618,523 | 4,453,073 | 1,131,849 | 3,321,224 | 44.3 | 11.3 | 33.0 | 115.2 | 6.55 | 58.8 | 60.3 |
| 1987 | 104,251,093 | 4,602,418 | 1,185,062 | 3,417,356 | 44.2 | 11.4 | 32.8 | 113.3 | 6.52 | 58.5 | 59.8 |
| 1988 | 107,967,838 | 4,749,506 | 1,208,574 | 3,540,932 | 44.0 | 11.2 | 32.8 | 111.5 | 6.48 | 58.5 | 60.4 |
| 1989 | 111,670,386 | 4,877,528 | 1,229,672 | 3,647,856 | 43.7 | 11.0 | 32.7 | 109.6 | 6.43 | 58.7 | 60.7 |
| 1990 | 115,414,069 | 4,979,805 | 1,238,482 | 3,741,323 | 43.1 | 10.7 | 32.4 | 107.8 | 6.36 | 59.0 | 61.4 |
| 1991 | 119,203,569 | 5,070,548 | 1,256,930 | 3,813,618 | 42.5 | 10.5 | 32.0 | 105.9 | 6.29 | 59.4 | 61.3 |
| 1992 | 122,375,179 | 5,146,942 | 1,290,628 | 3,856,314 | 41.8 | 10.5 | 31.3 | 103.9 | 6.21 | 59.6 | 60.7 |
| 1993 | 125,546,615 | 5,116,844 | 1,309,418 | 3,807,426 | 40.8 | 10.4 | 30.3 | 101.7 | 6.11 | 59.6 | 60.4 |
| 1994 | 129,245,139 | 5,188,381 | 1,321,834 | 3,866,547 | 40.1 | 10.2 | 29.9 | 99.5 | 6.01 | 59.7 | 60.6 |
| 1995 | 133,117,476 | 5,214,150 | 1,355,586 | 3,858,564 | 39.2 | 10.2 | 29.0 | 97.2 | 5.89 | 59.5 | 60.4 |
| 1996 | 137,234,810 | 5,283,367 | 1,351,457 | 3,931,910 | 38.5 | 9.9 | 28.7 | 94.7 | 5.77 | 59.9 | 61.1 |
| 1997 | 141,330,267 | 5,323,160 | 1,363,688 | 3,959,472 | 37.7 | 9.7 | 28.0 | 92.3 | 5.64 | 59.9 | 61.5 |
| 1998 | 145,476,106 | 5,391,873 | 1,360,060 | 4,031,813 | 37.1 | 9.4 | 27.7 | 89.9 | 5.51 | 60.2 | 62.1 |
| 1999 | 149,694,462 | 5,457,820 | 1,350,165 | 4,107,655 | 36.5 | 9.0 | 27.5 | 87.5 | 5.39 | 60.8 | 62.8 |
| 2000 | 154,369,924 | 5,503,880 | 1,349,760 | 4,154,120 | 35.8 | 8.8 | 27.0 | 85.3 | 5.26 | 61.2 | 63.1 |
| 2001 | 159,217,727 | 5,621,718 | 1,365,265 | 4,256,453 | 35.3 | 8.6 | 26.8 | 83.3 | 5.12 | 61.4 | 63.6 |
| 2002 | 163,262,807 | 5,707,878 | 1,383,913 | 4,323,965 | 34.9 | 8.5 | 26.4 | 81.5 | 5.01 | 61.7 | 63.7 |
| 2003 | 166,876,680 | 5,705,869 | 1,389,323 | 4,316,546 | 34.1 | 8.3 | 25.8 | 79.8 | 4.88 | 61.9 | 64.0 |
| 2004 | 170,648,620 | 5,728,041 | 1,397,637 | 4,330,404 | 33.5 | 8.2 | 25.3 | 78.4 | 4.75 | 61.9 | 64.4 |
| 2005 | 174,372,098 | 5,741,665 | 1,467,794 | 4,273,871 | 32.9 | 8.4 | 24.5 | 77.9 | 4.64 | 61.2 | 64.0 |
| 2006 | 178,069,984 | 5,780,328 | 1,397,071 | 4,383,257 | 32.4 | 7.8 | 24.6 | 75.7 | 4.53 | 62.1 | 65.7 |
| 2007 | 181,924,521 | 5,939,254 | 1,421,100 | 4,518,154 | 32.6 | 7.8 | 24.8 | 74.5 | 4.51 | 61.9 | 66.1 |
| 2008 | 185,931,955 | 6,026,112 | 1,440,035 | 4,586,077 | 32.4 | 7.7 | 24.6 | 73.1 | 4.43 | 61.9 | 66.5 |
| 2009 | 190,123,222 | 6,126,953 | 1,466,094 | 4,660,859 | 32.2 | 7.7 | 24.5 | 71.8 | 4.36 | 62.1 | 66.5 |
| 2010 | 194,454,498 | 6,251,649 | 1,479,575 | 4,772,074 | 32.1 | 7.6 | 24.5 | 70.5 | 4.30 | 62.3 | 66.9 |
| 2011 | 198,602,738 | 6,344,791 | 1,497,860 | 4,846,931 | 31.9 | 7.5 | 24.3 | 68.8 | 4.23 | 62.5 | 67.1 |
| 2012 | 202,205,861 | 6,416,601 | 1,518,663 | 4,897,938 | 31.6 | 7.5 | 24.1 | 67.1 | 4.17 | 62.7 | 67.2 |
| 2013 | 205,337,562 | 6,432,644 | 1,512,911 | 4,919,733 | 31.2 | 7.3 | 23.8 | 65.5 | 4.11 | 63.0 | 67.6 |
| 2014 | 208,251,628 | 6,374,716 | 1,522,217 | 4,852,499 | 30.5 | 7.3 | 23.2 | 63.8 | 4.01 | 63.1 | 67.7 |
| 2015 | 210,969,298 | 6,297,466 | 1,504,820 | 4,792,646 | 29.7 | 7.1 | 22.6 | 62.1 | 3.90 | 63.5 | 68.2 |
| 2016 | 213,524,840 | 6,291,208 | 1,510,500 | 4,780,708 | 29.3 | 7.0 | 22.3 | 60.4 | 3.83 | 63.7 | 68.3 |
| 2017 | 216,379,655 | 6,289,965 | 1,496,276 | 4,793,689 | 29.0 | 6.9 | 22.1 | 58.8 | 3.76 | 64.0 | 68.8 |
| 2018 | 219,731,479 | 6,302,081 | 1,508,129 | 4,793,952 | 28.6 | 6.8 | 21.8 | 57.1 | 3.69 | 64.2 | 69.0 |
| 2019 | 223,293,280 | 6,330,933 | 1,514,600 | 4,816,333 | 28.3 | 6.8 | 21.5 | 55.5 | 3.62 | 64.6 | 69.1 |
| 2020 | 227,196,741 | 6,362,705 | 1,606,293 | 4,756,412 | 28.0 | 7.1 | 20.9 | 53.9 | 3.56 | 63.9 | 68.8 |
| 2021 | 231,402,117 | 6,374,741 | 1,660,400 | 4,714,341 | 27.5 | 7.2 | 20.4 | 52.3 | 3.47 | 63.8 | 68.6 |

Human development
Human Development Index
Further information: List of administrative units of Pakistan by Human Development IndexPakistan's Human Development Index (HDI) value for 2018 is in the medium human development category with a score of 0.560 (152nd rank out of 189 countries and territories) compared to 0.614 (135th rank) for Bangladesh and 0.647 (129th rank) for India. From 1990 to 2018, Pakistan's HDI increased 38.6% from 0.404 to 0.560.
2018 Information on Pakistani provinces/regions, compared to other countries, estimated at three decimal places is provided below:
| Rank | Region | HDI (2018) |
|---|---|---|
| Medium human development | ||
| 1 | Islamabad Capital Territory | 0.875 |
| 2 | Azad Jammu & Kashmir | 0.611 |
| 3 | Gilgit-Baltistan | 0.593 |
| 4 | Punjab | 0.567 |
| – | 0.561 | |
| Low human development | ||
| 5 | Sindh | 0.533 |
| 6 | Khyber Pakhtunkhwa | 0.529 |
| 7 | Balochistan | 0.477 |
| 8 | FATA | 0.466 |
Literacy
definition: aged 10 and over with the "Ability to read and understand simple text in any language from a newspaper or magazine, write a simple letter and perform basic mathematical calculation (ie, counting and addition/subtraction)." as of 2018
| Total population | 62.3% |
| Male | 72.5% |
| Female | 51.8% |
Educational institutions by kind
- Primary schools: 156,592
- Middle schools: 320,611
- High schools: 23,964
- College of Arts and Sciences: 3,213
- Degree colleges: 1,202
- Technical and vocational institutions: 3,125
- Universities: 197
Nationality, ethnicity, and language
Ethnic groups
Main article: Ethnic groups in Pakistan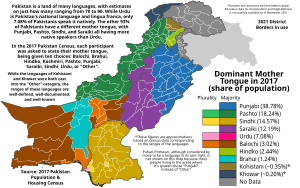
Ethnic groups in Pakistan (World Factbook)
Punjabis (44.7%) Pashtuns (18.24%) Sindhis (14.1%) Saraikis (8.4%) Muhajirs (7.6%) Balochis (3.6%) Others (6.3%)The major ethnolinguistic groups of Pakistan include Punjabis, Pashtuns,Sindhis, Saraikis, Muhajirs, Balochs, Paharis and Brahuis, with significant numbers of Kashmiris, Chitralis, Shina, Baltis, Kohistanis, Torwalis, Hazaras, Burusho, Wakhis, Kalash, Siddis and other various minorities.
Pakistan's census does not include the 1.4 million citizens of Afghanistan who are temporarily residing in Pakistan. Majority of them were born in Pakistan within the last four decades and are ethnically Pashtuns, Tajiks, Uzbeks and others.
Foreign-born population in Pakistan
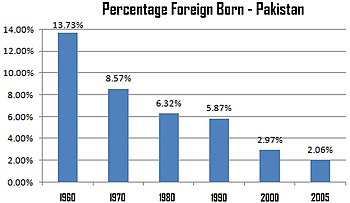
Main article: Immigration to PakistanAfter the independence of Pakistan in 1947, many Muslims from India migrated to Pakistan and they are the largest group of foreign-born residents. This group is dwindling because of its age. The second-largest group of foreign-born residents consists of refugees from Afghanistan who are expected to leave Pakistan by the end of 2018. There are also smaller groups of Muslim immigrants from countries such as Burma, Bangladesh, Iraq, Somalia, Iran, Tajikistan, and Uzbekistan, among others.
Languages
Main article: Languages of PakistanLanguages of Pakistan (2017)
Punjabi (38.78%) Pashto (18.24%) Sindhi (14.57%) Saraiki (12.19%) Urdu (7.08%) Balochi (3.02%) Hindko (2.24%) Brahui (1.24%) Kashmiri (0.17%) Others (2.47%)| Rank | Language | 2017 census | 1998 census | 1981 census | 1961 census | 1951 census |
|---|---|---|---|---|---|---|
| 1 | Punjabi* | 38.78% | 44.15% | 48.17% | 56.39% | 57.08% |
| 2 | Pashto | 18.24% | 14.42% | 13.35% | 8.47% | 8.16% |
| 3 | Sindhi | 14.57% | 14.1% | 12.7% | 12.59% | 12.85% |
| 4 | Saraiki* | 12.19% | 10.53% | 9.54% | ||
| 5 | Urdu | 7.08% | 7.57% | 7.60% | 7.57% | 7.05% |
| 6 | Balochi | 3.02% | 3.57% | 3.02% | 2.49% | 3.04% |
| 7 | Others | 6.12% | 4.66% | 5.62% | 12.49% | 11.82% |
Pakistan is a multilingual country with dozens of languages spoken as first languages. The majority Pakistan's languages belong to the Indo-Iranian group of the Indo-European language family.
Urdu is the national language and the lingua franca of Pakistan, and while sharing official status with English, it is the preferred and dominant language used for inter-communication between different ethnic groups. Numerous regional languages are spoken as first languages by Pakistan's various ethnolinguistic groups. Languages with more than a million speakers each include Punjabi, Pashto, Sindhi, Saraiki, Urdu, Balochi, Hindko, Pahari-Pothwari and Brahui.
Ethnologue lists 74 languages in Pakistan. Of these, 66 are indigenous and 8 are non-indigenous. In terms of their vitality, 7 are classified as 'institutional', 17 are 'developing', 37 are 'vigorous', 10 are 'in trouble', and 3 are 'dying'.
Urdu (national language)
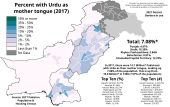
Urdu (اردو) is the national language (قومی زبان) and lingua franca of Pakistan. Although only about 7% of Pakistanis speak it as their first language, it is widely spoken and understood as a second language by the vast majority of Pakistanis.
No region in Pakistan uses Urdu as its mother tongue, though it is spoken as the first language of Muslim migrants (known as Muhajirs) in Pakistan who left India after independence in 1947. Urdu was chosen as a symbol of unity for the new state of Pakistan in 1947, because it had already served as a lingua franca among Muslims in north and northwest British India. It is written, spoken and used in all provinces/territories of Pakistan, and together with English as the main languages of instruction, although the people from differing provinces may have different native languages.
Urdu is taught as a compulsory subject up to higher secondary school in both English and Urdu medium school systems, which has produced millions of second-language Urdu speakers among people whose native language is one of the other languages of Pakistan – which in turn has led to the absorption of vocabulary from various regional Pakistani languages, while some Urdu vocabularies has also been assimilated by Pakistan's regional languages.
Punjabi
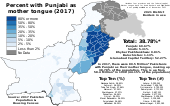
Punjabi (پنجابی) is an Indo-Aryan language primarily spoken in the Punjab province of Pakistan. Punjabi is the most widely spoken language in Pakistan. It is spoken as a first language by almost 39% of Pakistanis. It is the 11th most widely spoken language in India, and the third most-spoken native language in the Indian Subcontinent. The language is spoken among a significant overseas diaspora, particularly in Canada, the United States, and the United Kingdom. Punjabi is unusual among the Indo-Aryan languages and the broader Indo-European language family in its usage of lexical tone.
Pashto
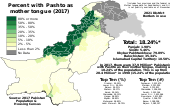
Pashto (پښتو) is an Iranian language spoken as a first language by more than 18% of Pakistanis, mainly in Khyber Pakhtunkhwa and in northern Balochistan as well as in ethnic Pashtun communities in the cities of Islamabad, Rawalpindi, Lahore, and most notably Karachi, which may have the largest Pashtun population of any city in the world.
There are three major dialect patterns within which the various individual dialects may be classified; these are Pakhto, which is the Northern (Peshawar) variety, and the softer Pashto spoken in the southern areas such as in Quetta.
Sindhi

Sindhi (سنڌي) is an Indo-Aryan language spoken as a first language by almost 15% of Pakistanis, mostly in the Sindh province of Pakistan. The name "Sindhi" is derived from Sindhu, the original name of the Indus River.
Like other languages of this family, Sindhi has passed through Old Indo-Aryan (Sanskrit) and Middle Indo-Aryan (Pali, secondary Prakrits, and Apabhramsha) stages of growth. 20th century Western scholars such as George Abraham Grierson believed that Sindhi descended specifically from the Vrācaḍa dialect of Apabhramsha (described by Markandeya as being spoken in Sindhu-deśa) but later work has shown this to be unlikely. It entered the New Indo-Aryan stage around the 10th century CE.
Saraiki

Saraiki (سرائیکی) is an Indo-Aryan language of the Lahnda group, spoken in central and southeastern Pakistan, primarily in the southern part of the province of Punjab. Saraiki is to a high degree mutually intelligible with Standard Punjabi and shares with it a large portion of its vocabulary and morphology. At the same time in its phonology it is radically different (particularly in the lack of tones, the preservation of the voiced aspirates and the development of implosive consonants), and has important grammatical features in common with the Sindhi language spoken to the south.
Saraiki is the language of about 26 million people in Pakistan, ranging across southern Punjab, southern Khyber Pakhtunkhwa, and border regions of northern Sindh and eastern Balochistan.
Balochi
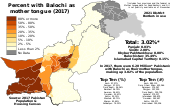
Balochi (بلوچی) is an Iranian language spoken as a first language by about 3% of Pakistanis, mostly in the Balochistan province. Rakshani is the major dialect group in terms of numbers. Sarhaddi is a sub-dialect of Rakshani. Other sub-dialects are Kalati (Qalati), Chagai-Kharani and Panjguri. Eastern Hill Balochi or Northern Balochi is very different from the rest.
Hindko

Hindko (ہندکو) is a cover term for a diverse group of Lahnda dialects spoken in several discontinuous areas in northwestern Pakistan, primarily in the provinces of Khyber Pakhtunkhwa and Punjab. Hindko is mutually intelligible with Punjabi and Saraiki, and has more affinities with the latter than with the former. Differences with other Punjabi varieties are more pronounced in the morphology and phonology than in the syntax. The word Hindko, commonly used to refer to a number of Indo-Aryan dialects spoken in the neighbourhood of Pashto, likely originally meant "the Indian language" (in contrast to Pashto). An alternative local name for this language group is Hindki.
Brahui

Brahui (براھوی) is a Dravidian language which is spoken in the central part of Balochistan province. Brahui is spoken in the central part of Pakistani Balochistan, mainly in Kalat, Khuzdar and Mastung districts, but also in smaller numbers in neighbouring districts, as well as in Afghanistan which borders Pakistani Balochistan; however, many members of the ethnic group no longer speak Brahui.
Minor languages
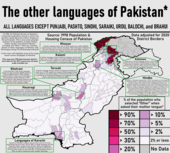
Other languages spoken by linguistic minorities include the languages listed below, with speakers ranging from a few hundred to tens of thousands. A few are highly endangered languages that may soon have no speakers at all. The United Nations Educational, Scientific and Cultural Organization defines five levels of language endangerment between "safe" (not endangered) and "extinct":
- Vulnerable - "most children speak the language, but it may be restricted to certain domains (e.g., home)"
- Definitely endangered – "children no longer learn the language as mother tongue in the home"
- Severely endangered – "language is spoken by grandparents and older generations; while the parent generation may understand it, they do not speak it to children or among themselves"
- Critically endangered – "the youngest speakers are grandparents and older, and they speak the language partially and infrequently"
- Extinct – "there are no speakers left; included in the Atlas if presumably extinct since the 1950s"
The list below includes the findings from the third edition of Atlas of the World's Languages in Danger (2010; formerly the Red Book of Endangered Languages), as well as the online edition of the aforementioned publication, both published by UNESCO.
| Language | Status | Comments | ISO 639–3 |
|---|---|---|---|
| Balti language | Vulnerable | Also spoken in: India | bft |
| Bashkarik language | Definitely endangered | gwc, xka | |
| Badeshi language | Critically endangered | bdz | |
| Bateri language | Definitely endangered | btv | |
| Bhadravahi language | Definitely endangered | Also spoken in: India | bhd |
| Brahui language | Vulnerable | Also spoken in: Afghanistan | brh |
| Burushaski language | Vulnerable | bsk | |
| Chilisso language | Severely endangered | clh | |
| Dameli language | Severely endangered | dml | |
| Domaaki language | Severely endangered | dmk | |
| Gawar-Bati language | Definitely endangered | Also spoken in: Afghanistan | gwt |
| Gowro language | Severely endangered | gwf | |
| Jad language | Definitely endangered | Also spoken in: India | jda |
| Kalasha language | Severely endangered | Not to be confused with Kalasha-ala language | kls |
| Kalkoti language | Severely endangered | ||
| Kamkata-vari language, Kata-vari dialect, Kamviri dialect | Definitely endangered | Also spoken in: Afghanistan | bsh, xvi |
| Khowar language | Vulnerable | khw | |
| Kundal Shahi language | Definitely endangered | Also spoken in: India | |
| Maiya language | Vulnerable | mvy | |
| Ormuri language | Definitely endangered | Also spoken in: Afghanistan | oru |
| Phalura language | Definitely endangered | phl | |
| Purik language | Vulnerable | Also spoken in: India | prx |
| Savi language | Definitely endangered | Also spoken in: Afghanistan | sdg |
| Spiti language | Vulnerable | Also spoken in: India | spt |
| Torwali language | Definitely endangered | trw | |
| Ushojo language | Definitely endangered | ush | |
| Wakhi language | Definitely endangered | Also spoken in: China, Tajikistan, Afghanistan | wbl |
| Yidgha language | Definitely endangered | ydg | |
| Zangskari language | Definitely endangered | Also spoken in: India | zau |
Religion
Main article: Religion in PakistanReligion in Pakistan (2017)
Islam (96.5%) Hinduism (2.1%) Christianity (1.3%) Other (0.1%)According to the World Factbook, Library of Congress, Oxford University, over 96% of the population of Pakistan is Muslim and the remaining 4% is Hindu, Christian, and others. Majority of the Muslims practice Sunni with a significant minority of Shi'as.
Nearly all Pakistani Sunni Muslims belong to the Hanafi school, although there are some Hanbalis and Ahl-e-Hadees. The majority of Shia Muslims belong to the Ithnā'Ashariyyah branch, while a smaller number practice Ismailism. There are small non-Muslim religious groups, including Christians, Ahmadis, Hindus, Buddhists, Sikhs, Baháʼís and Zoroastrians (Parsis),
| Religion | Population |
|---|---|
| Muslims | 200,362,718 |
| Hindus | 4,444,870 |
| Christians | 2,642,048 |
| Ahmadiyya | 191,737 |
| All Others | 43,253 |
- including Zoroastrians, Sikhs, and Buddhists
Recent changes and detailed demographic data
Pakistan Bureau of Statistics released religious data of Pakistan Census 2017 on 19 May 2021. 96.47% are Muslims, followed by 2.14% Hindus, 1.27% Christians, 0.09% Ahmadis and 0.02% others.
The 2017 census showed marginal increase in the share of Hindus.The census also recorded Pakistan's first Hindu-majority district, called Umerkot District.
On the other hand, Christianity in Pakistan, while increasing in raw numbers, has fallen significantly in percentage terms since the last census. Christians are concentrated in the most developed parts of Pakistan, Lahore District (over 5% Christian), Islamabad Capital Territory (over 4% Christian), and Northern Punjab.
The Ahmadiyya movement shrunk in size (both raw numbers and percentage) between 1998 and 2017, while remaining concentrated in Lalian Tehsil, Chiniot District, where approximately 13% of the population is Ahmadiyya.
Here are some maps of Pakistan's religious minority groups as of the 2017 census by district: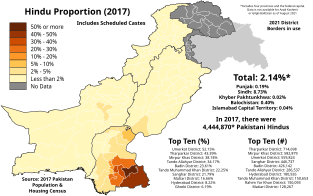 Hindu Proportion of each Pakistani District of each Pakistani District as of the 2017 Pakistan Census
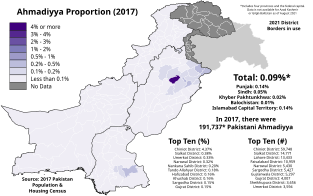 Ahmadiyya Proportion of each Pakistani District of each Pakistani District as of the 2017 Pakistan Census
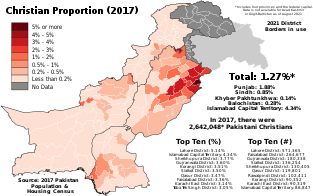 Christian Proportion of each Pakistani District of each Pakistani District as of the 2017 Pakistan CensusVirtually all people not belonging to one of these minority groups were Sunni or Shia Muslim, with the most religiously homogeneous areas found in Khyber Pakhtunkhwa.
Pakistanis around the world
Main article: Overseas Pakistanis| 4,000,000 | |
| 1,600,000 | |
| 1,200,000 | |
| 687,942 | |
| 215,000 | |
| 190,000 | |
| 180,000 | |
| 385,000 | |
| 61,913 | |
| 179,668 | |
| 52,500 | |
| 50,000 | |
| 39,257 | |
| 21,000 | |
| 10,000 | |
| 9,501 | |
| 22,118 |
See also
- Overseas Pakistani
- Minorities in Pakistan
- Ethnic groups of Pakistan
- Languages of Pakistan
- Indo-Iranians
Notes
- Major ethnolonguistic group in Azad Kashmir.
- ^ Lack of exact numbers of speakers of the language due to the language not being represented in the previous censuses. Upcoming 2022 Census of Pakistan will include Pahari-Pothwari as an option. Baart (2003, p. 10) provides an estimate of 3.8 million, presumably for the population in Pakistan alone. Lothers & Lothers (2010, p. 9) estimate the Pakistani population at well over 2.5 million and the UK diaspora at over 0.5 million. Note that the Pothwari speakers of the Pothohar Northern Punjab are ethnic Punjabis.
- Ethnolinguistic groups with a population of more than a million each.
- The term Hindki normally refers to a Hindko speaker and Shackle (1980, p. 482) reports that in Pashto the term has slightly pejorative connotations, which are avoided with the recently introduced term Hindkūn.
References
- ^ "Pakistan". Pakistan – The World Factbook. CIA. Archived from the original on 6 May 2022. Retrieved 8 May 2022.
- ^ "TABLE 4 – POPULATION BY SINGLE YEAR AGE, SEX AND RURAL/URBAN" (PDF). Table 04n.pdf. Pakistan Bureau of Statistics. 2021. Archived (PDF) from the original on 24 December 2021. Retrieved 9 May 2022.
- ^ "TABLE – 1 AREA, POPULATION BY SEX, SEX RATIO, POPULATION DENSITY, URBAN PROPORTION, HOUSEHOLD SIZE AND ANNUAL GROWTH RATE" (PDF). National.pdf. Pakistan Bureau of Statistics. 19 May 2021. Archived (PDF) from the original on 27 September 2021. Retrieved 17 October 2021.
- ^ "STATISTICAL YEAROOK 2020" (PDF). Statistical Yearbook 2020.pdf. AJ&K BUREAU OF STATISTICS PLANNING & DEVELOPMENT DEPARTMENT. 5 January 2021. Archived (PDF) from the original on 17 October 2021. Retrieved 17 October 2021.
- ^ "GILGIT-BALTISTAN at a GLANCE 2020" (PDF). Gilgit Baltistan at a Glance New Design.cdr. Government of Gilgit-Baltistan Planning & Development Department Statistical & Research Cell (SRC). 20 January 2021. Archived (PDF) from the original on 17 October 2021. Retrieved 17 October 2021.
- ^ "World Population Prospects 2019". World Population Prospects – Population Division – United Nations. United Nations. June 2019. Retrieved 8 May 2022.
- Simons, Gary F.; Fennig, Charles D., eds. (2017). "Pakistan – Languages". Ethnologue: Languages of the World (20th ed.). Archived from the original on 2 September 2017.
- "Languages of Pakistan". Glottolog 4.5 – Languages. Glottolog. Archived from the original on 12 May 2022. Retrieved 12 May 2022.
- ^ "TABLE 11 – POPULATION BY MOTHER TONGUE, SEX AND RURAL/ URBAN" (PDF). www.pbs.gov.pk. Pakistan Bureau of Statistics. 2021. Archived from the original (PDF) on 9 April 2022. Retrieved 12 May 2022.
- "Refugee Data Finder". UNHCR – Refugee Statistics. UNHCR. Archived from the original on 12 May 2022. Retrieved 12 May 2022.
- ^ 1951-98 Population of Administrative Units (As on 1st March, 1998) (PDF). POPULATION CENSUS ORGANIZATION STATISTICS DIVISION GOVERNMENT OF PAKISTAN. January 2002. Archived from the original (PDF) on 23 August 2020. Retrieved 25 August 2020.
- "Crisis-hit Pakistan strikes $3bn IMF bailout deal". BBC News. 30 June 2023. Retrieved 29 August 2023.
- "TABLE – 2 URBAN LOCALITIES BY POPULATION SIZE AND THEIR POPULATION BY SEX, ANNUAL GROWTH RATE AND HOUSEHOLD SIZE" (PDF). Table 02n.pdf. Pakistan Bureau of Statistics. 2021. Archived (PDF) from the original on 24 December 2021. Retrieved 12 May 2022.
- ^ "Coverage of Birth and Death Registration – 2021". Coverage of Birth and Death Registration – 2021. United Nations. February 2021. Archived from the original on 23 January 2022. Retrieved 8 May 2022.
- "Data Sources". World Population Prospects – Population Division – United Nations. United Nations. June 2019. Archived from the original on 8 May 2022. Retrieved 8 May 2022.
- ^ "Pakistan Demographic and Health Survey 2006–07" (PDF). Pakistan Demographic and Health Survey 2006–07 . National Institute of Population Studies Islamabad, Pakistan. June 2008. Archived (PDF) from the original on 26 March 2022. Retrieved 8 May 2022.
- "Pakistan Social & Living Standards Measurement Survey" (PDF). National provincial level Report 2007-08.doc. Pakistan Bureau of Statistics. 2008–2009. Archived (PDF) from the original on 4 February 2022. Retrieved 8 May 2022.
- "PAKISTAN SOCIAL AND LIVING STANDARDS MEASUREMENT SURVEY (2011–12)" (PDF). complete_report_pslm11_12.pdf. Pakistan Bureau of Statistics. May 2013. Archived (PDF) from the original on 21 March 2022. Retrieved 8 May 2022.
- ^ "Pakistan Demographic and Health Survey 2012–13" (PDF). Pakistan Demographic and Health Survey 2012–13 . National Institute of Population Studies Islamabad, Pakistan. December 2013. Archived (PDF) from the original on 24 April 2022. Retrieved 8 May 2022.
- "PSLM 2013–14" (PDF). PSLM. Pakistan Bureau of Statistics. 2014–2015. Archived (PDF) from the original on 4 February 2022. Retrieved 8 May 2022.
- ^ "Pakistan Demographic and Health Survey 2017–18" (PDF). Pakistan Demographic and Health Survey 2017–18 . National Institute of Population Studies Islamabad, Pakistan. January 2019. Archived (PDF) from the original on 28 April 2022. Retrieved 8 May 2022.
- "Pakistan Social & Living Standards Measurement Survey (PSLM) 2018–19 National /Provincial (Social Report)" (PDF). TECHNICAL NOTES. Pakistan Bureau of Statistics. June 2020. Archived (PDF) from the original on 10 April 2022. Retrieved 8 May 2022.
- "Pakistan Maternal Mortality Survey 2019" (PDF). Pakistan Maternal Mortality Survey 2019 . National Institute of Population Studies Islamabad, Pakistan. December 2020. Archived (PDF) from the original on 8 May 2022. Retrieved 8 May 2022.
- "PAKISTAN DEMOGRAPHIC SURVEY 2020" (PDF). Table of Content. Pakistan Bureau of Statistics. 14 April 2022. Archived (PDF) from the original on 8 May 2022. Retrieved 8 May 2022.
- "Untitled". Multiple Indicator Cluster Survey (MICS) Punjab 2011. UNICEF MICS. 2 September 2012. Retrieved 6 June 2022.
- "Punjab Multiple Indicator Cluster Survey 2014 Final Report" (PDF). Pakistan (Punjab) 2014 MICS_English.pdf. UNICEF MICS. December 2015. Archived (PDF) from the original on 6 June 2022. Retrieved 6 June 2022.
- "Sindh Multiple Indicator Cluster Survey 2014 Final Report" (PDF). Pakistan (Sindh) 2014 MICS_English.pdf. UNICEF MICS. December 2015. Archived (PDF) from the original on 28 July 2021. Retrieved 6 June 2022.
- "Khyber Pakhtunkhwa Multiple Indicator Cluster Survey 2016–17 Final Report" (PDF). Pakistan 2016-17 MICS (Khyber Pakhtunkhwa) Final Report_English.pdf. UNICEF MICS. June 2018. Archived (PDF) from the original on 6 June 2022. Retrieved 6 June 2022.
- "Gilgit-Baltistan Multiple Indicator Cluster Survey 2016–17 Final Report" (PDF). Microsoft Word - 001A. Gilgit-Baltistan MICS 2016-17_26102017.docx. UNICEF MICS. September 2017. Archived (PDF) from the original on 18 June 2020. Retrieved 6 June 2022.
- ^ "Punjab Multiple Indicator Cluster Survey 2017–18 Survey Findings Report" (PDF). MICS SFR_Final_English.pdf. UNICEF MICS. November 2018. Archived (PDF) from the original on 6 April 2022. Retrieved 6 June 2022.
- ^ "Sindh Multiple Indicator Cluster Survey 2018–19 Survey Findings Report" (PDF). MergedFile. UNICEF MICS. February 2021. Archived (PDF) from the original on 6 June 2022. Retrieved 6 June 2022.
- ^ "Khyber Pakhtunkhwa Multiple Indicator Cluster Survey 2019 Survey Findings Report" (PDF). Pakistan 2019 MICS (Khyber Pakhtunkhwa) Survey Findings Report_English.pdf. UNICEF MICS. December 2021. Archived from the original (PDF) on 19 January 2022. Retrieved 6 June 2022.
- ^ "Balochistan Multiple Indicator Cluster Survey (MICS) 2019-20 Survey Findings Report" (PDF). MICS6 Survey Findings Report. UNICEF MICS. August 2022. Archived (PDF) from the original on 30 September 2022. Retrieved 30 September 2022.
- "Azad Jammu and Kashmir Multiple Indicator Cluster Survey 2020–21 Survey Findings Report" (PDF). Untitled-1. UNICEF MICS. December 2021. Archived from the original (PDF) on 6 June 2022. Retrieved 6 June 2022.
- "2019 HD Report". January 2018.
- "Human Development Indices and Indicators: 2018 Statistical Update: Pakistan" (PDF).
- ^ "Sub-national HDI – Area Database – Global Data Lab". hdi.globaldatalab.org. Retrieved 3 December 2018.
- "Pakistan Economic Survey 2018–19 Chapter 10: Education" (PDF). Economic Survey of Pakistan. 10 June 2019. Retrieved 7 July 2019.
- "HEC recognized Universities". Archived from the original on 9 February 2014.
- "Pakistan Education Statistics 2007–08" (PDF). Archived from the original (PDF) on 2 October 2011. Retrieved 29 July 2010.
- "Pakistan", The World Factbook, Central Intelligence Agency, 26 May 2022
- Tyagi, Vidya Prakash (2009). Martial races of undivided India. Kalpaz Publisher. ISBN 978-81-7835-775-1.
The Gujjar or Gurjar are an ethnic group in India and Pakistan. Alternative spellings include Gurjara, Gujjar and Goojar. The Gujjars follow Hinduism, Sikhism and Islam. The Hindu Gujjars belong to the traditional Kshatriya Varna in Hinduism, while the Muslim Gujjars are considered to be a Potwari race in India and Pakistan
- Harriss-White, Barbara; Heyer, Judith (21 December 2009). The Comparative Political Economy of Development: Africa and South Asia. Routledge. ISBN 978-1-135-17193-3.
Gujjar: multi-religious, 'martial' ethnic group in Afghanistan, Pakistan and India.
- "Pakistan", The World Factbook, Central Intelligence Agency, 26 May 2022
- Qadeer, Mohammad (22 November 2006). Pakistan – Social and Cultural Transformations in a Muslim Nation. Routledge. p. 70. ISBN 978-1-134-18617-4.
- Ali, Shaheen Sardar; Rehman, Javaid (1 February 2013). Indigenous Peoples and Ethnic Minorities of Pakistan: Constitutional and Legal Perspectives. Routledge. ISBN 978-1-136-77868-1.
- "Registered Afghan Refugees in Pakistan". UNHCR. 31 December 2020. Retrieved 30 July 2021.
- "Onward Movements of Afghan Refugees" (PDF). UNHCR. March–April 2021. Retrieved 20 August 2021.
- "Government delivered first new Proof of Registration smartcards to Afghan refugees". 25 May 2021. Retrieved 30 July 2021.
- "Voluntary Repatriation Update" (PDF). Pakistan: UNHCR. November 2016. Archived from the original (PDF) on 20 February 2017. Retrieved 26 November 2017.
- "Pakistan to extend stay for Afghans by one more year". 6 December 2017. Retrieved 6 December 2017.
- "Pakistan". gum: globalization urbanization migration. Archived from the original on 4 January 2011.
- "CCI defers approval of census results until elections". Retrieved 12 April 2020.
- ^ Ashraf, Hina (22 March 2022). "The ambivalent role of Urdu and English in multilingual Pakistan: a Bourdieusian study". Language Policy. 22 (1): 25–48. doi:10.1007/s10993-022-09623-6. ISSN 1573-1863. PMC 8939399. PMID 35340722.
- ^ Ashraf, Muhammad Azeem; Turner, David A.; Laar, Rizwan Ahmed (January 2021). "Multilingual Language Practices in Education in Pakistan: The Conflict Between Policy and Practice". SAGE Open. 11 (1): 215824402110041. doi:10.1177/21582440211004140. ISSN 2158-2440. S2CID 232484396.
- Rengel, Marian (15 December 2003). Pakistan: A Primary Source Cultural Guide. The Rosen Publishing Group, Inc. p. 38. ISBN 978-0-8239-4001-1.
- Kachru, Braj B.; Kachru, Yamuna; Sridhar, S. N. (27 March 2008). Language in South Asia. Cambridge University Press. p. 34. ISBN 978-1-139-46550-2.
- Eberhard, David M.; Simons, Gary F.; Fennig, Charles D., eds. (2019). "Pakistan: Status". Ethnologue: Languages of the World (22nd ed.). Archived from the original on 17 April 2019.
- Muzaffar, Sharmin; Behera, Pitambar (2014). "Error analysis of the Urdu verb markers: a comparative study on Google and Bing machine translation platforms". Aligarh Journal of Linguistics. 4 (1–2): 1.
Modern Standard Urdu, a register of the Hindustani language, is the national language, lingua-franca and is one of the two official languages along with English in Pakistan and is spoken in all over the world. It is also one of the 22 scheduled languages and officially recognized languages in the Constitution of India and has been conferred the status of the official language in many Indian states of Bihar, Telangana, Jammu, and Kashmir, Uttar Pradesh, West Bengal, and New Delhi. Urdu is one of the members of the new or modern Indo-Aryan language group within the Indo-European family of languages.
- "PAKISTAN". Official U.S. Marine Corps. Archived from the original on 31 January 2022. Retrieved 11 May 2022.
- The World Factbook. Central Intelligence Agency. 1992. p. 264.
- Khan, M. Ilyas (12 September 2015). "Pakistan's confusing move to Urdu". BBC News. Retrieved 3 December 2019.
- "Dec 25, 2017 | Why did the Quaid make Urdu Pakistan's state language?". Dawn Epaper. 25 December 2017.
- "EDUCATION SYSTEM PROFILES Education in Pakistan". World Education Services. 25 February 2020.
English has been the main language of instruction at the elementary and secondary levels since colonial times. It remains the predominant language of instruction in private schools but has been increasingly replaced with Urdu in public schools. Punjab province, for example, recently announced that it will begin to use Urdu as the exclusive medium of instruction in schools beginning in 2020. Depending on the location and predominantly in rural areas, regional languages are used as well, particularly in elementary education. The language of instruction in higher education is mostly English, but some programs and institutions teach in Urdu.
- Robina Kausar; Muhammad Sarwar; Muhammad Shabbir (eds.). "The History of the Urdu Language Together with Its Origin and Geographic Distribution" (PDF). International Journal of Innovation and Research in Educational Sciences. 2 (1).
- Ahmad, Aijazuddin (2009). Geography of the South Asian Subcontinent: A Critical Approach. Concept Publishing Company. ISBN 978-81-8069-568-1.
- Hock, Hans Henrich; Bashir, Elena (24 May 2016). The Languages and Linguistics of South Asia: A Comprehensive Guide. Walter de Gruyter GmbH & Co KG. ISBN 978-3-11-042330-3.
- Raj, Ali (30 April 2017). "The case for Urdu as Pakistan's official language". Herald Magazine. Archived from the original on 28 October 2019. Retrieved 28 October 2019.
- "CCI defers approval of census results until elections". Dawn. 21 March 2021. Retrieved 10 March 2021. The figure of 80.54 million is calculated from the reported 38.78% for the speakers of Punjabi and the 207.685 million total population of Pakistan.
- Bhatia, Tej (1999). "Lexican Anaphors and Pronouns in Punjabi". In Lust, Barbara; Gair, James (eds.). Lexical Anaphors and Pronouns in Selected South Asian Languages. Walter de Gruyter. p. 637. ISBN 978-3-11-014388-1. Other tonal Indo-Aryan languages include Hindko, Dogri, Western Pahari, Sylheti and some Dardic languages.
- Sharmeen Obaid-Chinoy (17 July 2009). "Karachi's Invisible Enemy". PBS. Retrieved 24 August 2010.
- "In a city of ethnic friction, more tinder". The National. 24 August 2009. Archived from the original on 16 January 2010. Retrieved 24 August 2010.
- "Columnists | The Pakhtun in Karachi". Time. 28 August 2010. Retrieved 8 September 2011.
- "Demographic divide". The Friday Times. Vol. XXIII, no. 22. 15–21 July 2011. Archived from the original on 9 December 2012. Retrieved 25 August 2012.
- Lieven, Anatol (4 May 2021). "An Afghan Tragedy: The Pashtuns, the Taliban and the State". Survival. 63 (3): 7–36. doi:10.1080/00396338.2021.1930403. ISSN 0039-6338. S2CID 235219004.
- "Sindhi". The Languages Gulper. Retrieved 29 January 2013.
- Wadhwani, Y. K. (1981). "The Origin of the Sindhi Language" (PDF). Bulletin of the Deccan College Post-Graduate and Research Institute. 40: 192–201. JSTOR 42931119. Retrieved 9 April 2021.
- "Encyclopædia Britannica". Britannica.com. Retrieved 11 May 2013.
- "Sindhi Language – Structure, Writing & Alphabet". Mustgo.com. Retrieved 1 March 2022.
- ^ Shackle, Christopher. "Siraiki language". Encyclopædia Britannica. Retrieved 18 October 2016.
- Rahman 1995, p. 16.
- Shackle 1977, p. 389.
- Simons, Gary F.; Fennig, Charles D., eds. (2017). "Saraiki". Ethnologue: Languages of the World (20th ed.). Archived from the original on 12 July 2017.
- Rahman 1996, p. 211.
- Shackle 1979, pp. 200–201.
- Shackle 1980, p. 486.
- Shackle 1980, p. 482; Rensch 1992, pp. 3–4. See there for alternative etymologies.
- Rensch 1992, p. 4.
- Parkin 1989, p. 37.
- Gordon, Raymond G., Jr. (2005). Languages of Pakistan. In Ethnologue Languages of the World (15th ed.). Dallas, TX: SIL International.
- ^ Moseley, Christopher, ed. (2010). Atlas of the World' s Languages in Danger. Memory of Peoples (3rd ed.). Paris: UNESCO Publishing. ISBN 978-92-3-104096-2. Retrieved 11 April 2015.
- "UNESCO Atlas of the World's Languages in danger". www.unesco.org.
- "POPULATION BY RELIGION" (PDF). Pakistan Bureau of Statistics, Government of Pakistan: 1. Archived from the original (PDF) on 29 March 2020. Retrieved 5 June 2019.
- ^ "Pakistan, Islam in". Oxford Centre for Islamic Studies. Oxford University Press. Archived from the original on 18 June 2013. Retrieved 29 August 2010.
Approximately 97 percent of Pakistanis are Muslim. The majority are Sunnis following the Hanafi school of Islamic law. Between 20 and 25 percent are Shias, mostly Twelvers.
- "Religions: Muslim 95% (Sunni 65%, Shia 30%), other (includes Hindus and Christians ) 5%". Central Intelligence Agency. 2010. Archived from the original on 17 June 2009. Retrieved 24 August 2010.
- "Country Profile: Pakistan" (PDF). Library of Congress Country Studies on Pakistan. Library of Congress. February 2005. Retrieved 1 September 2010.
Religion: The overwhelming majority of the population (96 percent) is Muslim, of whom approximately 75 percent are Sunni and 25 percent Shi'a.
- Fuchs, Maria-Magdalena; Fuchs, Simon Wolfgang (12 December 2019). "Religious Minorities in Pakistan: Identities, Citizenship and Social Belonging". South Asia: Journal of South Asian Studies. 43 (1): 52–67. doi:10.1080/00856401.2020.1695075. ISSN 0085-6401. S2CID 214107453.
- "Pakistan's population is 207.68m, shows 2017 census result". 19 May 2021.
- Data Access and Dissemination Systems (DADS). "U.S. Census website". Retrieved 14 January 2024.
- Canada, Government of Canada, Statistics (25 October 2017). "Immigration and Ethnocultural Diversity Highlight Tables – Ethnic Origin, both sexes, age (total), Canada, 2016 Census – 25% Sample data". www12.statcan.gc.ca.
{{cite web}}: CS1 maint: multiple names: authors list (link) - "About PSAA". Archived from the original on 21 September 2019. Retrieved 29 March 2020.
- "Most Pakistanis and Urdu speakers live in this Australian state". sbs.com.au. Retrieved 27 March 2018.
- "05183: Innvandrere og norskfødte med innvandrerforeldre, etter kjønn og landbakgrunn 1970–2021-PX-Web SSB". SSB (in Norwegian). Retrieved 27 September 2021.
- "在留外国人統計(旧登録外国人統計) 在留外国人統計 月次 2022年12月 | ファイル | 統計データを探す".
Sources
- Baart, Joan L. G. (2003). Sustainable Development and the Maintenance of Pakistan's Indigenous Languages. Islamabad.
- Lothers, Michael; Lothers, Laura (April 2010). Pahari and Pothwari: a sociolinguistic survey (Report). SIL Electronic Survey Reports 2010-012.
- Parkin, Robert (January 1989). "Some comments on Brahui kinship terminology". Indo-Iranian Journal. 32 (1): 37–43. doi:10.1007/BF00182435 (inactive 15 March 2024). JSTOR 24654607. S2CID 161638780.
{{cite journal}}: CS1 maint: DOI inactive as of March 2024 (link) - Rahman, Tariq (1995). "The Siraiki Movement in Pakistan". Language Problems & Language Planning. 19 (1): 1–25. doi:10.1075/lplp.19.1.01rah.
- Rahman, Tariq (1996). Language and politics in Pakistan. Oxford University Press. ISBN 978-0-19-577692-8.
- Rensch, Calvin R. (1992). "The Language Environment of Hindko-Speaking People". In O'Leary, Clare F.; Rensch, Calvin R.; Hallberg, Calinda E. (eds.). Hindko and Gujari. Sociolinguistic Survey of Northern Pakistan. Islamabad: National Institute of Pakistan Studies, Quaid-i-Azam University and Summer Institute of Linguistics. ISBN 969-8023-13-5.
- Shackle, Christopher (1977). "Siraiki: A Language Movement in Pakistan". Modern Asian Studies. 11 (3): 379–403. doi:10.1017/s0026749x00014190. ISSN 0026-749X. JSTOR 311504. S2CID 144829301.
- Shackle, Christopher (1979). "Problems of classification in Pakistan Panjab". Transactions of the Philological Society. 77 (1): 191–210. doi:10.1111/j.1467-968X.1979.tb00857.x. ISSN 0079-1636.
- Shackle, Christopher (1980). "Hindko in Kohat and Peshawar". Bulletin of the School of Oriental and African Studies. 43 (3): 482–510. doi:10.1017/S0041977X00137401. ISSN 0041-977X. S2CID 129436200.
External links
- Pakistan Bureau of Statistics
- infopak.gov.pk – Ministry of Information and Broadcasting
- Population Reference Bureau
- statpak.gov.pk – Population by mother tongue
- US Census: International Data Base (IDB)
| Links to related articles | |||||||||||||||||||||||||||||||||||||||||||||||||||||||||||||||||||||||||||||||||||||||||||||||||||||||||||||||||||||||||||||||||||||
|---|---|---|---|---|---|---|---|---|---|---|---|---|---|---|---|---|---|---|---|---|---|---|---|---|---|---|---|---|---|---|---|---|---|---|---|---|---|---|---|---|---|---|---|---|---|---|---|---|---|---|---|---|---|---|---|---|---|---|---|---|---|---|---|---|---|---|---|---|---|---|---|---|---|---|---|---|---|---|---|---|---|---|---|---|---|---|---|---|---|---|---|---|---|---|---|---|---|---|---|---|---|---|---|---|---|---|---|---|---|---|---|---|---|---|---|---|---|---|---|---|---|---|---|---|---|---|---|---|---|---|---|---|---|
| |||||||||||||||||||||||||||||||||||||||||||||||||||||||||||||||||||||||||||||||||||||||||||||||||||||||||||||||||||||||||||||||||||||
