Main article: 1944 United States presidential election
The 1944 United States presidential election in North Dakota took place on November 7, 1944, as part of the 1944 United States presidential election . Voters chose four representatives, or electors, to the Electoral College , who voted for president and vice president .
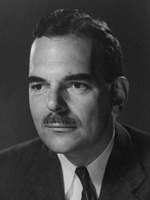
North Dakota was won by Governor Thomas E. Dewey (R –New York ), running with Governor John Bricker , with 53.84% of the popular vote, against incumbent President Franklin D. Roosevelt (D –New York ), running with Missouri Senator Harry S. Truman , with 45.48% of the popular vote. North Dakota was one of six states that became more Democratic compared to 1940, alongside Michigan, Minnesota, New York, Illinois, and Rhode Island.
Results
Results by county
County
Thomas Edmund Dewey
Franklin Delano Roosevelt
Norman Mattoon Thomas
Claude A. Watson
Margin
Total votes cast
#
%
#
%
#
%
#
%
#
%
Adams
966
58.62%
668
40.53%
13
0.79%
1
0.06%
298
18.08%
1,648
Barnes
3,696
55.55%
2,922
43.92%
22
0.33%
13
0.20%
774
11.63%
6,653
Benson
1,726
43.04%
2,261
56.38%
17
0.42%
6
0.15%
-535
-13.34%
4,010
Billings
354
62.54%
209
36.93%
2
0.35%
1
0.18%
145
25.62%
566
Bottineau
2,663
57.15%
1,953
41.91%
38
0.82%
6
0.13%
710
15.24%
4,660
Bowman
785
55.67%
609
43.19%
15
1.06%
1
0.07%
176
12.48%
1,410
Burke
1,540
54.47%
1,226
43.37%
58
2.05%
3
0.11%
314
11.11%
2,827
Burleigh
4,616
59.95%
3,061
39.75%
14
0.18%
9
0.12%
1,555
20.19%
7,700
Cass
10,661
50.37%
10,390
49.09%
51
0.24%
65
0.31%
271
1.28%
21,167
Cavalier
2,011
46.68%
2,274
52.79%
4
0.09%
19
0.44%
-263
-6.10%
4,308
Dickey
2,134
61.11%
1,339
38.34%
9
0.26%
10
0.29%
795
22.77%
3,492
Divide
1,225
44.19%
1,513
54.58%
26
0.94%
8
0.29%
-288
-10.39%
2,772
Dunn
1,374
59.79%
919
39.99%
4
0.17%
1
0.04%
455
19.80%
2,298
Eddy
974
47.56%
1,042
50.88%
24
1.17%
8
0.39%
-68
-3.32%
2,048
Emmons
2,255
76.99%
656
22.40%
13
0.44%
5
0.17%
1,599
54.59%
2,929
Foster
891
44.39%
1,102
54.91%
11
0.55%
3
0.15%
-211
-10.51%
2,007
Golden Valley
709
61.23%
443
38.26%
4
0.35%
2
0.17%
266
22.97%
1,158
Grand Forks
5,668
42.19%
7,707
57.37%
18
0.13%
41
0.31%
-2,039
-15.18%
13,434
Grant
1,745
80.64%
410
18.95%
5
0.23%
4
0.18%
1,335
61.69%
2,164
Griggs
990
44.45%
1,228
55.14%
4
0.18%
5
0.22%
-238
-10.69%
2,227
Hettinger
1,812
76.42%
554
23.37%
4
0.17%
1
0.04%
1,258
53.06%
2,371
Kidder
1,397
66.43%
693
32.95%
5
0.24%
8
0.38%
704
33.48%
2,103
LaMoure
2,298
61.25%
1,422
37.90%
14
0.37%
18
0.48%
876
23.35%
3,752
Logan
1,904
86.47%
294
13.35%
3
0.14%
1
0.05%
1,610
73.12%
2,202
McHenry
3,141
61.44%
1,934
37.83%
24
0.47%
13
0.25%
1,207
23.61%
5,112
McIntosh
2,682
91.98%
226
7.75%
8
0.27%
0
0.00%
2,456
84.22%
2,916
McKenzie
1,241
43.35%
1,592
55.61%
9
0.31%
21
0.73%
-351
-12.26%
2,863
McLean
2,822
53.37%
2,326
43.99%
130
2.46%
10
0.19%
496
9.38%
5,288
Mercer
2,504
84.71%
445
15.05%
5
0.17%
2
0.07%
2,059
69.65%
2,956
Morton
3,537
65.32%
1,850
34.16%
20
0.37%
8
0.15%
1,687
31.15%
5,415
Mountrail
1,666
45.11%
1,981
53.64%
22
0.60%
24
0.65%
-315
-8.53%
3,693
Nelson
1,506
43.77%
1,925
55.94%
3
0.09%
7
0.20%
-419
-12.18%
3,441
Oliver
756
76.83%
219
22.26%
6
0.61%
3
0.30%
537
54.57%
984
Pembina
2,410
44.95%
2,903
54.15%
2
0.04%
46
0.86%
-493
-9.20%
5,361
Pierce
1,992
60.07%
1,307
39.41%
11
0.33%
6
0.18%
685
20.66%
3,316
Ramsey
2,505
49.28%
2,539
49.95%
29
0.57%
10
0.20%
-34
-0.67%
5,083
Ransom
2,044
55.06%
1,639
44.15%
21
0.57%
8
0.22%
405
10.91%
3,712
Renville
1,046
48.34%
1,095
50.60%
19
0.88%
4
0.18%
-49
-2.26%
2,164
Richland
4,402
57.74%
3,192
41.87%
11
0.14%
19
0.25%
1,210
15.87%
7,624
Rolette
1,070
37.78%
1,745
61.62%
12
0.42%
5
0.18%
-675
-23.83%
2,832
Sargent
1,488
50.72%
1,426
48.60%
11
0.37%
9
0.31%
62
2.11%
2,934
Sheridan
1,910
82.76%
386
16.72%
6
0.26%
6
0.26%
1,524
66.03%
2,308
Sioux
673
59.98%
445
39.66%
1
0.09%
3
0.27%
228
20.32%
1,122
Slope
434
49.43%
439
50.00%
5
0.57%
0
0.00%
-5
-0.57%
878
Stark
2,852
64.85%
1,534
34.88%
5
0.11%
7
0.16%
1,318
29.97%
4,398
Steele
1,042
43.89%
1,320
55.60%
8
0.34%
4
0.17%
-278
-11.71%
2,374
Stutsman
4,220
56.20%
3,243
43.19%
27
0.36%
19
0.25%
977
13.01%
7,509
Towner
1,097
47.99%
1,185
51.84%
3
0.13%
1
0.04%
-88
-3.85%
2,286
Traill
2,370
48.68%
2,479
50.91%
10
0.21%
10
0.21%
-109
-2.24%
4,869
Walsh
2,471
34.07%
4,747
65.46%
10
0.14%
24
0.33%
-2,276
-31.38%
7,252
Ward
5,514
48.30%
5,822
50.99%
58
0.51%
23
0.20%
-308
-2.70%
11,417
Wells
2,529
61.59%
1,557
37.92%
13
0.32%
7
0.17%
972
23.67%
4,106
Williams
2,217
36.57%
3,748
61.82%
87
1.43%
11
0.18%
-1,531
-25.25%
6,063
Total
118,535
53.84%
100,144
45.48%
954
0.43%
549
0.25%
18,391
8.35%
220,182
Counties that flipped from Republican to Democratic
See also
References
"United States Presidential election of 1944 - Encyclopædia Britannica" . Retrieved December 22, 2017."1944 Election for the Fortieth Term (1945-49)" . Retrieved December 22, 2017."1944 Presidential General Election Results - North Dakota" . Retrieved December 22, 2017."The American Presidency Project - Election of 1944" . Retrieved December 22, 2017."ND US President Race, November 07, 1944" . Our Campaigns.
Categories :
Text is available under the Creative Commons Attribution-ShareAlike License. Additional terms may apply.
**DISCLAIMER** We are not affiliated with Wikipedia, and Cloudflare.
The information presented on this site is for general informational purposes only and does not constitute medical advice.
You should always have a personal consultation with a healthcare professional before making changes to your diet, medication, or exercise routine.
AI helps with the correspondence in our chat.
We participate in an affiliate program. If you buy something through a link, we may earn a commission 💕
↑
 County Results


