Main article: 1944 United States presidential election
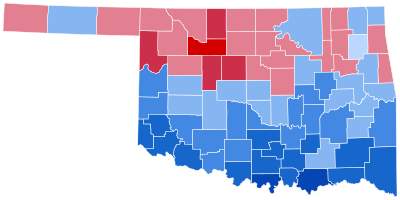
1944 United States presidential election in Oklahoma Oklahoma votes to the Electoral College
Roosevelt
40-50%
50-60%
60-70%
70-80%
80-90%
Dewey
50-60%
60-70%
70-80%
The 1944 United States presidential election in Oklahoma took place on November 7, 1944, as part of the 1944 United States presidential election . Voters chose ten representatives, or electors, to the Electoral College , who voted for president and vice president .
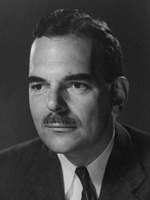
Oklahoma was won by incumbent President Franklin D. Roosevelt (D –New York ), running with Senator Harry S. Truman , with 55.57% of the popular vote, against Governor Thomas E. Dewey (R –New York ), running with Governor John Bricker , with 44.20% of the popular vote.
Results
Results by county
County
Franklin Delano Roosevelt
Thomas Edmund Dewey
Norman Mattoon Thomas
Margin
Total votes cast
#
%
#
%
#
%
#
%
Adair
2,760
49.60%
2,792
50.18%
12
0.22%
-32
-0.58%
5,564
Alfalfa
1,716
33.11%
3,434
66.27%
32
0.62%
-1,718
-33.15%
5,182
Atoka
2,172
58.81%
1,515
41.02%
6
0.16%
657
17.79%
3,693
Beaver
1,355
41.12%
1,913
58.06%
27
0.82%
-558
-16.93%
3,295
Beckham
3,608
63.78%
2,034
35.96%
15
0.27%
1,574
27.82%
5,657
Blaine
2,097
37.51%
3,480
62.24%
14
0.25%
-1,383
-24.74%
5,591
Bryan
7,180
80.91%
1,677
18.90%
17
0.19%
5,503
62.01%
8,874
Caddo
6,850
55.23%
5,529
44.58%
24
0.19%
1,321
10.65%
12,403
Canadian
4,800
50.57%
4,674
49.24%
18
0.19%
126
1.33%
9,492
Carter
9,184
78.81%
2,446
20.99%
24
0.21%
6,738
57.82%
11,654
Cherokee
3,415
50.50%
3,336
49.33%
12
0.18%
79
1.17%
6,763
Choctaw
4,358
75.46%
1,404
24.31%
13
0.23%
2,954
51.15%
5,775
Cimarron
746
47.25%
822
52.06%
11
0.70%
-76
-4.81%
1,579
Cleveland
5,240
58.86%
3,642
40.91%
21
0.24%
1,598
17.95%
8,903
Coal
1,959
71.92%
760
27.90%
5
0.18%
1,199
44.02%
2,724
Comanche
7,342
63.96%
4,109
35.80%
28
0.24%
3,233
28.16%
11,479
Cotton
2,711
67.88%
1,266
31.70%
17
0.43%
1,445
36.18%
3,994
Craig
3,363
51.86%
3,111
47.97%
11
0.17%
252
3.89%
6,485
Creek
8,342
52.36%
7,549
47.38%
41
0.26%
793
4.98%
15,932
Custer
3,928
53.79%
3,349
45.86%
25
0.34%
579
7.93%
7,302
Delaware
2,373
46.29%
2,660
51.89%
93
1.81%
-287
-5.60%
5,126
Dewey
1,808
45.35%
2,166
54.33%
13
0.33%
-358
-8.98%
3,987
Ellis
1,104
36.18%
1,939
63.55%
8
0.26%
-835
-27.37%
3,051
Garfield
7,879
41.13%
11,211
58.53%
65
0.34%
-3,332
-17.39%
19,155
Garvin
5,328
71.80%
2,086
28.11%
7
0.09%
3,242
43.69%
7,421
Grady
7,689
65.28%
4,069
34.55%
20
0.17%
3,620
30.74%
11,778
Grant
2,045
40.26%
3,021
59.48%
13
0.26%
-976
-19.22%
5,079
Greer
2,984
73.43%
1,075
26.45%
5
0.12%
1,909
46.97%
4,064
Harmon
1,933
79.03%
503
20.56%
10
0.41%
1,430
58.46%
2,446
Harper
1,056
42.70%
1,394
56.37%
23
0.93%
-338
-13.67%
2,473
Haskell
2,924
58.00%
2,102
41.70%
15
0.30%
822
16.31%
5,041
Hughes
5,009
66.73%
2,484
33.09%
13
0.17%
2,525
33.64%
7,506
Jackson
4,866
78.59%
1,313
21.20%
13
0.21%
3,553
57.38%
6,192
Jefferson
2,948
74.88%
974
24.74%
15
0.38%
1,974
50.14%
3,937
Johnston
2,339
71.35%
925
28.22%
14
0.43%
1,414
43.14%
3,278
Kay
8,656
47.45%
9,498
52.07%
88
0.48%
-842
-4.62%
18,242
Kingfisher
2,175
38.78%
3,417
60.92%
17
0.30%
-1,242
-22.14%
5,609
Kiowa
4,175
66.48%
2,081
33.14%
24
0.38%
2,094
33.34%
6,280
Latimer
1,948
59.85%
1,296
39.82%
11
0.34%
652
20.03%
3,255
Le Flore
5,660
60.54%
3,667
39.22%
22
0.24%
1,993
21.32%
9,349
Lincoln
3,910
44.74%
4,801
54.94%
28
0.32%
-891
-10.20%
8,739
Logan
3,795
45.09%
4,586
54.48%
36
0.43%
-791
-9.40%
8,417
Love
1,955
81.29%
446
18.54%
4
0.17%
1,509
62.74%
2,405
Major
965
24.09%
3,019
75.38%
21
0.52%
-2,054
-51.29%
4,005
Marshall
2,261
74.77%
752
24.87%
11
0.36%
1,509
49.90%
3,024
Mayes
3,830
49.93%
3,822
49.82%
19
0.25%
8
0.10%
7,671
McClain
3,301
68.76%
1,492
31.08%
8
0.17%
1,809
37.68%
4,801
McCurtain
5,322
78.83%
1,419
21.02%
10
0.15%
3,903
57.81%
6,751
McIntosh
3,190
55.28%
2,569
44.52%
12
0.21%
621
10.76%
5,771
Murray
2,602
71.96%
1,005
27.79%
9
0.25%
1,597
44.16%
3,616
Muskogee
11,679
58.42%
8,280
41.42%
31
0.16%
3,399
17.00%
19,990
Noble
2,300
42.81%
3,060
56.95%
13
0.24%
-760
-14.14%
5,373
Nowata
2,581
48.46%
2,730
51.26%
15
0.28%
-149
-2.80%
5,326
Okfuskee
3,291
60.09%
2,177
39.75%
9
0.16%
1,114
20.34%
5,477
Oklahoma
57,812
57.59%
42,464
42.30%
116
0.12%
15,348
15.29%
100,392
Okmulgee
9,737
64.09%
5,430
35.74%
25
0.16%
4,307
28.35%
15,192
Osage
6,846
55.17%
5,557
44.78%
7
0.06%
1,289
10.39%
12,410
Ottawa
5,876
53.69%
5,056
46.19%
13
0.12%
820
7.49%
10,945
Pawnee
2,460
42.52%
3,310
57.21%
16
0.28%
-850
-14.69%
5,786
Payne
5,624
48.06%
6,048
51.68%
30
0.26%
-424
-3.62%
11,702
Pittsburg
8,535
67.60%
4,068
32.22%
23
0.18%
4,467
35.38%
12,626
Pontotoc
6,552
68.73%
2,960
31.05%
21
0.22%
3,592
37.68%
9,533
Pottawatomie
9,130
58.31%
6,486
41.42%
43
0.27%
2,644
16.88%
15,659
Pushmataha
2,848
70.50%
1,181
29.23%
11
0.27%
1,667
41.26%
4,040
Roger Mills
2,015
63.44%
1,148
36.15%
13
0.41%
867
27.30%
3,176
Rogers
3,209
46.13%
3,739
53.75%
8
0.12%
-530
-7.62%
6,956
Seminole
7,116
60.86%
4,560
39.00%
16
0.14%
2,556
21.86%
11,692
Sequoyah
3,571
55.18%
2,893
44.70%
8
0.12%
678
10.48%
6,472
Stephens
6,189
68.97%
2,766
30.82%
19
0.21%
3,423
38.14%
8,974
Texas
2,119
54.75%
1,731
44.73%
20
0.52%
388
10.03%
3,870
Tillman
3,902
72.13%
1,496
27.65%
12
0.22%
2,406
44.47%
5,410
Tulsa
33,436
43.89%
42,663
56.00%
89
0.12%
-9,227
-12.11%
76,188
Wagoner
2,373
40.58%
3,467
59.29%
8
0.14%
-1,094
-18.71%
5,848
Washington
5,090
43.72%
6,533
56.12%
18
0.15%
-1,443
-12.40%
11,641
Washita
3,524
56.40%
2,706
43.31%
18
0.29%
818
13.09%
6,248
Woods
2,426
42.75%
3,226
56.85%
23
0.41%
-800
-14.10%
5,675
Woodward
2,152
41.19%
3,055
58.47%
18
0.34%
-903
-17.28%
5,225
Totals
401,549
55.57%
319,424
44.20%
1,663
0.23%
82,125
11.36%
722,636
Counties that flipped Republican to Democratic
Counties that flipped Democratic to Republican
See also
References
"United States Presidential election of 1944 - Encyclopædia Britannica" . Retrieved July 19, 2018."1944 Election for the Fortieth Term (1945-49)" . Retrieved July 19, 2018."1944 Presidential General Election Results - Oklahoma" . Retrieved July 20, 2018."The American Presidency Project - Election of 1944" . Retrieved July 20, 2018.America at the Polls: A Handbook of Presidential Election Statistics 1920-1964 ; pp. 363-364 ISBN 0405077114
Categories :
Text is available under the Creative Commons Attribution-ShareAlike License. Additional terms may apply.
**DISCLAIMER** We are not affiliated with Wikipedia, and Cloudflare.
The information presented on this site is for general informational purposes only and does not constitute medical advice.
You should always have a personal consultation with a healthcare professional before making changes to your diet, medication, or exercise routine.
AI helps with the correspondence in our chat.
We participate in an affiliate program. If you buy something through a link, we may earn a commission 💕
↑
 County Results


