Main article: 1928 United States presidential election
| ||||||||||||||||||||||||||
| ||||||||||||||||||||||||||
 County Results County Results
| ||||||||||||||||||||||||||
| ||||||||||||||||||||||||||
The 1928 United States presidential election in Oklahoma took place on November 6, 1928, as part of the 1928 United States presidential election which was held throughout all contemporary 48 states. Voters chose ten representatives, or electors to the Electoral College, who voted for president and vice president. In its early years, Oklahoma was a “Solid South” state whose founding fathers like "Alfalfa Bill" Murray and Charles N. Haskell had disfranchised most of its black population via literacy tests and grandfather clauses, the latter of which would be declared unconstitutional in Guinn v. United States. In 1920 this “Solid South” state, nonetheless, joined the Republican landslide of Warren G. Harding, electing a GOP senator and five congressmen, but in 1922 the Democratic Party returned to their typical ascendancy as the state GOP became heatedly divided amongst themselves .
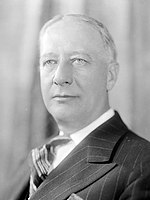
Like many states in the Southern United States at the time, Oklahoma had some influence from the Ku Klux Klan, and was almost entirely part of the Southern Protestant “Bible Belt”, the nomination of anti-Prohibition Catholic New York Governor Al Smith as the Democratic nominee was extremely controversial, with prominent former Senator Robert Latham Owen refusing steadfastly to endorse him, despite nominating dry Southern Democrat Senator Joseph Taylor Robinson of Arkansas.
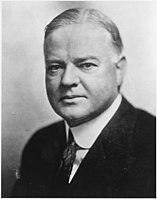
Early polls showed a massive trend away from Smith, with a September poll saying seventy-six thousand Oklahoma Democrats would vote for Republican nominees, former Secretary of Commerce Herbert Hoover of California and Senate Majority Leader Charles Curtis of Kansas, and a mid-October poll saying Hoover would receive seventy percent of the vote in Oklahoma. At the end of October, although the number of Oklahoma Democrats believed to be supporting Hoover had not fallen, and a finding that the Republicans had helped enroll one hundred and fifty thousand new voters, Hoover's margin was reduced to fifty thousand.
As it turned out, the later poll was over-favourable to Smith. Hoover ultimately won the state by a margin of 28.28 percentage points. This was the first election since statehood when Oklahoma had voted more Republican than the nation at large, and the only one until 1960. In some previously Democratic counties in southwestern Oklahoma, Hoover gained vote shares more than thirty percent higher than Calvin Coolidge had in 1924, despite the fact that Smith visited the state in September and gave a major speech on the issue of religious tolerance.
Hoover carried all but eleven of Oklahoma's 77 counties, with only culturally Southern Choctaw Country in the southeast (an area also known as "Little Dixie") remaining loyal to Smith – and even there Democratic margins were smaller than usual for the era. He was the only Republican until Richard Nixon’s 1972 landslide to carry the following counties: Carter, Cotton, Harmon, Jackson, Jefferson, Murray and Tillman. Hoover was also the first Republican presidential candidate to win the following counties: Beckham, Cleveland, Grady, Hughes, McClain and Pontotoc.
Results
| 1928 United States presidential election in Oklahoma | |||||
|---|---|---|---|---|---|
| Party | Candidate | Votes | Percentage | Electoral votes | |
| Republican | Herbert Hoover | 394,046 | 63.72% | 10 | |
| Democratic | Alfred E. Smith | 219,174 | 35.44% | 0 | |
| Socialist | Norman Thomas | 3,924 | 0.63% | 0 | |
| Farmer Labor | Frank Webb | 1,283 | 0.21% | 0 | |
| Totals | 618,427 | 100.00% | 10 | ||
Results by county
| County | Herbert Clark Hoover Republican |
Alfred Emmanuel Smith Democratic |
Norman Mattoon Thomas Socialist |
Frank E. Webb Farmer-Labor |
Margin | Total votes cast | |||||
|---|---|---|---|---|---|---|---|---|---|---|---|
| # | % | # | % | # | % | # | % | # | % | ||
| Adair | 2,867 | 59.35% | 1,944 | 40.24% | 14 | 0.29% | 6 | 0.12% | 923 | 19.11% | 4,831 |
| Alfalfa | 4,224 | 77.98% | 1,086 | 20.05% | 83 | 1.53% | 24 | 0.44% | 3,138 | 57.93% | 5,417 |
| Atoka | 1,572 | 42.94% | 2,056 | 56.16% | 24 | 0.66% | 9 | 0.25% | -484 | -13.22% | 3,661 |
| Beaver | 2,596 | 73.67% | 887 | 25.17% | 33 | 0.94% | 8 | 0.23% | 1,709 | 48.50% | 3,524 |
| Beckham | 3,810 | 62.36% | 2,201 | 36.02% | 78 | 1.28% | 21 | 0.34% | 1,609 | 26.33% | 6,110 |
| Blaine | 3,413 | 67.83% | 1,543 | 30.66% | 65 | 1.29% | 11 | 0.22% | 1,870 | 37.16% | 5,032 |
| Bryan | 3,014 | 43.37% | 3,885 | 55.90% | 30 | 0.43% | 21 | 0.30% | -871 | -12.53% | 6,950 |
| Caddo | 7,313 | 64.27% | 3,885 | 34.14% | 123 | 1.08% | 57 | 0.50% | 3,428 | 30.13% | 11,378 |
| Canadian | 5,011 | 63.63% | 2,786 | 35.38% | 54 | 0.69% | 24 | 0.30% | 2,225 | 28.25% | 7,875 |
| Carter | 6,538 | 55.80% | 5,086 | 43.41% | 77 | 0.66% | 15 | 0.13% | 1,452 | 12.39% | 11,716 |
| Cherokee | 2,963 | 54.49% | 2,446 | 44.98% | 16 | 0.29% | 13 | 0.24% | 517 | 9.51% | 5,438 |
| Choctaw | 2,541 | 49.32% | 2,581 | 50.10% | 23 | 0.45% | 7 | 0.14% | -40 | -0.78% | 5,152 |
| Cimarron | 1,139 | 66.03% | 566 | 32.81% | 14 | 0.81% | 6 | 0.35% | 573 | 33.22% | 1,725 |
| Cleveland | 3,738 | 61.35% | 2,291 | 37.60% | 50 | 0.82% | 14 | 0.23% | 1,447 | 23.75% | 6,093 |
| Coal | 1,283 | 42.82% | 1,681 | 56.11% | 19 | 0.63% | 13 | 0.43% | -398 | -13.28% | 2,996 |
| Comanche | 5,069 | 62.45% | 2,956 | 36.42% | 70 | 0.86% | 22 | 0.27% | 2,113 | 26.03% | 8,117 |
| Cotton | 2,419 | 59.76% | 1,605 | 39.65% | 19 | 0.47% | 5 | 0.12% | 814 | 20.11% | 4,048 |
| Craig | 3,511 | 54.48% | 2,897 | 44.96% | 23 | 0.36% | 13 | 0.20% | 614 | 9.53% | 6,444 |
| Creek | 12,254 | 67.92% | 5,693 | 31.55% | 67 | 0.37% | 28 | 0.16% | 6,561 | 36.37% | 18,042 |
| Custer | 4,576 | 68.56% | 1,995 | 29.89% | 93 | 1.39% | 10 | 0.15% | 2,581 | 38.67% | 6,674 |
| Delaware | 2,603 | 59.70% | 1,706 | 39.13% | 33 | 0.76% | 18 | 0.41% | 897 | 20.57% | 4,360 |
| Dewey | 2,486 | 65.35% | 1,175 | 30.89% | 112 | 2.94% | 31 | 0.81% | 1,311 | 34.46% | 3,804 |
| Ellis | 1,953 | 62.80% | 1,122 | 36.08% | 25 | 0.80% | 10 | 0.32% | 831 | 26.72% | 3,110 |
| Garfield | 12,748 | 77.77% | 3,503 | 21.37% | 90 | 0.55% | 51 | 0.31% | 9,245 | 56.40% | 16,392 |
| Garvin | 3,321 | 47.44% | 3,589 | 51.26% | 72 | 1.03% | 19 | 0.27% | -268 | -3.83% | 7,001 |
| Grady | 6,332 | 62.64% | 3,667 | 36.27% | 84 | 0.83% | 26 | 0.26% | 2,665 | 26.36% | 10,109 |
| Grant | 4,371 | 74.30% | 1,449 | 24.63% | 47 | 0.80% | 16 | 0.27% | 2,922 | 49.67% | 5,883 |
| Greer | 2,262 | 57.48% | 1,645 | 41.80% | 13 | 0.33% | 15 | 0.38% | 617 | 15.68% | 3,935 |
| Harmon | 1,431 | 56.85% | 1,060 | 42.11% | 18 | 0.72% | 8 | 0.32% | 371 | 14.74% | 2,517 |
| Harper | 1,844 | 66.45% | 872 | 31.42% | 47 | 1.69% | 12 | 0.43% | 972 | 35.03% | 2,775 |
| Haskell | 2,580 | 53.95% | 2,172 | 45.42% | 13 | 0.27% | 17 | 0.36% | 408 | 8.53% | 4,782 |
| Hughes | 3,937 | 55.18% | 3,169 | 44.41% | 23 | 0.32% | 6 | 0.08% | 768 | 10.76% | 7,135 |
| Jackson | 3,440 | 57.72% | 2,493 | 41.83% | 21 | 0.35% | 6 | 0.10% | 947 | 15.89% | 5,960 |
| Jefferson | 2,251 | 53.79% | 1,916 | 45.78% | 12 | 0.29% | 6 | 0.14% | 335 | 8.00% | 4,185 |
| Johnston | 1,294 | 41.80% | 1,766 | 57.04% | 27 | 0.87% | 9 | 0.29% | -472 | -15.25% | 3,096 |
| Kay | 13,829 | 76.15% | 4,196 | 23.10% | 95 | 0.52% | 41 | 0.23% | 9,633 | 53.04% | 18,161 |
| Kingfisher | 4,063 | 69.08% | 1,780 | 30.26% | 27 | 0.46% | 12 | 0.20% | 2,283 | 38.81% | 5,882 |
| Kiowa | 4,116 | 63.54% | 2,270 | 35.04% | 66 | 1.02% | 26 | 0.40% | 1,846 | 28.50% | 6,478 |
| Latimer | 1,368 | 45.77% | 1,583 | 52.96% | 21 | 0.70% | 17 | 0.57% | -215 | -7.19% | 2,989 |
| Le Flore | 5,168 | 52.48% | 4,622 | 46.94% | 37 | 0.38% | 20 | 0.20% | 546 | 5.54% | 9,847 |
| Lincoln | 6,118 | 70.74% | 2,405 | 27.81% | 102 | 1.18% | 24 | 0.28% | 3,713 | 42.93% | 8,649 |
| Logan | 6,277 | 72.72% | 2,251 | 26.08% | 74 | 0.86% | 30 | 0.35% | 4,026 | 46.64% | 8,632 |
| Love | 843 | 39.93% | 1,268 | 60.07% | 0 | 0.00% | 0 | 0.00% | -425 | -20.13% | 2,111 |
| Major | 2,891 | 78.73% | 674 | 18.36% | 91 | 2.48% | 16 | 0.44% | 2,217 | 60.38% | 3,672 |
| Marshall | 1,063 | 42.50% | 1,358 | 54.30% | 70 | 2.80% | 10 | 0.40% | -295 | -11.80% | 2,501 |
| Mayes | 3,004 | 57.61% | 2,161 | 41.45% | 40 | 0.77% | 9 | 0.17% | 843 | 16.17% | 5,214 |
| McClain | 2,399 | 55.07% | 1,913 | 43.92% | 32 | 0.73% | 12 | 0.28% | 486 | 11.16% | 4,356 |
| McCurtain | 1,915 | 39.79% | 2,877 | 59.78% | 17 | 0.35% | 4 | 0.08% | -962 | -19.99% | 4,813 |
| McIntosh | 2,742 | 56.88% | 2,044 | 42.40% | 28 | 0.58% | 7 | 0.15% | 698 | 14.48% | 4,821 |
| Murray | 1,631 | 51.53% | 1,498 | 47.33% | 26 | 0.82% | 10 | 0.32% | 133 | 4.20% | 3,165 |
| Muskogee | 9,972 | 60.92% | 6,343 | 38.75% | 37 | 0.23% | 17 | 0.10% | 3,629 | 22.17% | 16,369 |
| Noble | 3,607 | 66.21% | 1,777 | 32.62% | 41 | 0.75% | 23 | 0.42% | 1,830 | 33.59% | 5,448 |
| Nowata | 2,930 | 62.18% | 1,763 | 37.42% | 12 | 0.25% | 7 | 0.15% | 1,167 | 24.77% | 4,712 |
| Okfuskee | 3,612 | 58.25% | 2,513 | 40.53% | 61 | 0.98% | 15 | 0.24% | 1,099 | 17.72% | 6,201 |
| Oklahoma | 36,608 | 69.13% | 16,073 | 30.35% | 237 | 0.45% | 35 | 0.07% | 20,535 | 38.78% | 52,953 |
| Okmulgee | 9,149 | 60.77% | 5,834 | 38.75% | 64 | 0.43% | 9 | 0.06% | 3,315 | 22.02% | 15,056 |
| Osage | 10,555 | 67.52% | 5,010 | 32.05% | 57 | 0.36% | 10 | 0.06% | 5,545 | 35.47% | 15,632 |
| Ottawa | 8,144 | 64.03% | 4,488 | 35.28% | 69 | 0.54% | 19 | 0.15% | 3,656 | 28.74% | 12,720 |
| Pawnee | 4,489 | 68.82% | 1,949 | 29.88% | 66 | 1.01% | 19 | 0.29% | 2,540 | 38.94% | 6,523 |
| Payne | 7,864 | 72.19% | 2,904 | 26.66% | 83 | 0.76% | 42 | 0.39% | 4,960 | 45.53% | 10,893 |
| Pittsburg | 5,875 | 49.20% | 5,960 | 49.91% | 87 | 0.73% | 20 | 0.17% | -85 | -0.71% | 11,942 |
| Pontotoc | 3,356 | 50.87% | 3,203 | 48.55% | 26 | 0.39% | 12 | 0.18% | 153 | 2.32% | 6,597 |
| Pottawatomie | 8,478 | 68.57% | 3,797 | 30.71% | 58 | 0.47% | 31 | 0.25% | 4,681 | 37.86% | 12,364 |
| Pushmataha | 1,616 | 52.88% | 1,384 | 45.29% | 44 | 1.44% | 12 | 0.39% | 232 | 7.59% | 3,056 |
| Roger Mills | 1,948 | 63.51% | 986 | 32.15% | 114 | 3.72% | 19 | 0.62% | 962 | 31.37% | 3,067 |
| Rogers | 3,477 | 61.38% | 2,147 | 37.90% | 31 | 0.55% | 10 | 0.18% | 1,330 | 23.48% | 5,665 |
| Seminole | 8,072 | 64.60% | 4,423 | 35.40% | 0 | 0.00% | 0 | 0.00% | 3,649 | 29.20% | 12,495 |
| Sequoyah | 3,296 | 55.04% | 2,692 | 44.96% | 0 | 0.00% | 0 | 0.00% | 604 | 10.09% | 5,988 |
| Stephens | 5,192 | 62.71% | 2,982 | 36.02% | 80 | 0.97% | 25 | 0.30% | 2,210 | 26.69% | 8,279 |
| Texas | 2,890 | 69.16% | 1,240 | 29.67% | 33 | 0.79% | 16 | 0.38% | 1,650 | 39.48% | 4,179 |
| Tillman | 3,331 | 60.60% | 2,141 | 38.95% | 17 | 0.31% | 8 | 0.15% | 1,190 | 21.65% | 5,497 |
| Tulsa | 38,769 | 70.49% | 16,062 | 29.20% | 128 | 0.23% | 39 | 0.07% | 22,707 | 41.29% | 54,998 |
| Wagoner | 2,726 | 60.62% | 1,745 | 38.80% | 19 | 0.42% | 7 | 0.16% | 981 | 21.81% | 4,497 |
| Washington | 7,258 | 73.48% | 2,563 | 25.95% | 41 | 0.42% | 15 | 0.15% | 4,695 | 47.53% | 9,877 |
| Washita | 3,572 | 63.28% | 2,024 | 35.85% | 35 | 0.62% | 14 | 0.25% | 1,548 | 27.42% | 5,645 |
| Woods | 3,941 | 70.38% | 1,550 | 27.68% | 87 | 1.55% | 22 | 0.39% | 2,391 | 42.70% | 5,600 |
| Woodward | 3,188 | 69.06% | 1,347 | 29.18% | 59 | 1.28% | 22 | 0.48% | 1,841 | 39.88% | 4,616 |
| Total | 394,046 | 63.72% | 219,174 | 35.44% | 3,924 | 0.63% | 1,283 | 0.21% | 174,872 | 28.28% | 618,427 |
See also
References
- Ewing, Cortez Arthur Milton; An Introduction to the Government of Oklahoma (1939), p. 72. Published by Americanism Committee, American Legion, Department of Oklahoma
- Fairclough, Adam (June 25, 2002). Better Day Coming: Blacks and Equality, 1890-2000. Penguin. p. 82. ISBN 0142001295.
- Debo, Angie; And Still the Waters Run: The Betrayal of the Five Civilized Tribes, pp. 318-319 ISBN 9780691005782
- Debo, And Still the Waters Run, p. 322
- Phillips, Kevin P.; The Emerging Republican Majority, p. 317 ISBN 978-0-691-16324-6
- Bateman, David A.; Katznelson, Ira; Lapinski, John S. (2018). Southern Nation: Congress and White Supremacy After Reconstruction. Princeton University Press. p. 375. ISBN 978-0691126494.
- "76,000 Democrats Flock to Hoover: Anti-Smith faction in Oklahoma Signifies Intention to Vote Republican Ticket". The Evening Star. Washington, D.C. September 28, 1928. p. 4.
- "Smith Cuts Down Hoover's Lead in Magazine Poll: With Nearly 2,000,000 Ballots in New York, Governor Reduces Hoover's Lead to 63%". Shreveport Journal. Shreveport, Louisiana. October 13, 1928. p. 11.
- "Oklahoma Expects Vote of 650,000: 150,000 believed Added in Registration; State Is Still Viewed Hoover's". The Evening Star. Washington, D.C. October 28, 1982. p. 11.
- Lichtman, Allan J. (1979). Prejudice and the Old Politics: The Presidential Election of 1928. University of North Carolina Press. p. 68. ISBN 0807813583.
- ^ Menendez, Albert J. (2005). The Geography of Presidential Elections in the United States, 1868-2004. McFarland. pp. 280–283. ISBN 0786422173.
- "1928 Presidential General Election Results – Oklahoma". Dave Leip's Atlas of U.S. Presidential Elections. Retrieved August 2, 2013.
- "OK US Presidential Election Race, November 06, 1928". Our Campaigns.
| (1927 ←) 1928 United States elections (→ 1929) | |
|---|---|
| U.S. President |
|
| U.S. Senate |
|
| U.S. House of Representatives |
|
| Gubernatorial |
|
| State legislatures | |
| General |
|
| State and district results of the 1928 United States presidential election | ||
|---|---|---|
|  | |
| Elections in the United States | |
|---|---|
| |


