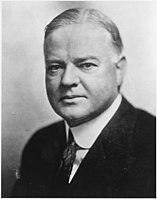
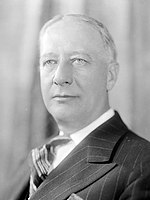
Main article: 1928 United States presidential election
1928 United States presidential election in Nebraska
Hoover
50-60%
60-70%
70-80%
80-90%
Smith
50-60%
60-70%
The 1928 United States presidential election in Nebraska was held on November 6, 1928, as part of the 1928 United States presidential election . State voters chose eight electors to the Electoral College , who voted for president and vice president .
Nebraska was won by the Republican candidate Herbert Hoover , who won the state by 147,786 votes or 27.01 percentage points against Al Smith .
Results
Results by county
County
Herbert Clark Hoover
Alfred Emmanuel Smith
Norman Mattoon Thomas
Margin
Total votes cast
#
%
#
%
#
%
#
%
Adams
7,194
70.63%
2,926
28.73%
66
0.65%
4,268
41.90%
10,186
Antelope
4,277
67.80%
2,016
31.96%
15
0.24%
2,261
35.84%
6,308
Arthur
402
69.43%
169
29.19%
8
1.38%
233
40.24%
579
Banner
548
86.30%
81
12.76%
6
0.94%
467
73.54%
635
Blaine
484
73.11%
175
26.44%
3
0.45%
309
46.68%
662
Boone
3,816
62.57%
2,260
37.06%
23
0.38%
1,556
25.51%
6,099
Box Butte
3,028
70.71%
1,238
28.91%
16
0.37%
1,790
41.80%
4,282
Boyd
1,653
58.72%
1,143
40.60%
19
0.67%
510
18.12%
2,815
Brown
1,907
74.06%
636
24.70%
32
1.24%
1,271
49.36%
2,575
Buffalo
7,460
72.22%
2,801
27.12%
68
0.66%
4,659
45.11%
10,329
Burt
3,551
66.34%
1,783
33.31%
19
0.35%
1,768
33.03%
5,353
Butler
2,930
45.65%
3,465
53.99%
23
0.36%
-535
-8.34%
6,418
Cass
4,970
63.91%
2,739
35.22%
68
0.87%
2,231
28.69%
7,777
Cedar
3,206
49.57%
3,241
50.12%
20
0.31%
-35
-0.54%
6,467
Chase
1,540
71.90%
579
27.03%
23
1.07%
961
44.86%
2,142
Cherry
2,905
69.04%
1,285
30.54%
18
0.43%
1,620
38.50%
4,208
Cheyenne
2,618
62.29%
1,563
37.19%
22
0.52%
1,055
25.10%
4,203
Clay
4,105
69.27%
1,767
29.82%
54
0.91%
2,338
39.45%
5,926
Colfax
1,432
34.14%
2,746
65.47%
16
0.38%
-1,314
-31.33%
4,194
Cuming
2,418
47.95%
2,597
51.50%
28
0.56%
-179
-3.55%
5,043
Custer
8,379
76.40%
2,506
22.85%
82
0.75%
5,873
53.55%
10,967
Dakota
1,709
49.35%
1,754
50.65%
0
0.00%
-45
-1.30%
3,463
Dawes
3,276
73.32%
1,173
26.25%
19
0.43%
2,103
47.07%
4,468
Dawson
5,125
74.25%
1,718
24.89%
59
0.85%
3,407
49.36%
6,902
Deuel
1,197
74.39%
403
25.05%
9
0.56%
794
49.35%
1,609
Dixon
2,982
64.81%
1,607
34.93%
12
0.26%
1,375
29.88%
4,601
Dodge
6,250
60.59%
4,030
39.07%
35
0.34%
2,220
21.52%
10,315
Douglas
47,551
52.60%
42,267
46.75%
587
0.65%
5,284
5.84%
90,405
Dundy
1,575
76.42%
472
22.90%
14
0.68%
1,103
53.52%
2,061
Fillmore
3,479
60.55%
2,235
38.90%
32
0.56%
1,244
21.65%
5,746
Franklin
2,533
63.44%
1,443
36.14%
17
0.43%
1,090
27.30%
3,993
Frontier
2,335
71.76%
879
27.01%
40
1.23%
1,456
44.74%
3,254
Furnas
3,760
73.17%
1,339
26.06%
40
0.78%
2,421
47.11%
5,139
Gage
8,378
69.83%
3,526
29.39%
94
0.78%
4,852
40.44%
11,998
Garden
1,470
77.82%
404
21.39%
15
0.79%
1,066
56.43%
1,889
Garfield
1,180
83.04%
235
16.54%
6
0.42%
945
66.50%
1,421
Gosper
875
64.10%
480
35.16%
10
0.73%
395
28.94%
1,365
Grant
398
70.94%
160
28.52%
3
0.53%
238
42.42%
561
Greeley
1,457
40.88%
2,098
58.87%
9
0.25%
-641
-17.99%
3,564
Hall
6,862
66.58%
3,391
32.90%
53
0.51%
3,471
33.68%
10,306
Hamilton
3,634
68.77%
1,606
30.39%
44
0.83%
2,028
38.38%
5,284
Harlan
2,702
69.98%
1,055
27.32%
104
2.69%
1,647
42.66%
3,861
Hayes
917
65.83%
440
31.59%
36
2.58%
477
34.24%
1,393
Hitchcock
2,022
73.71%
698
25.45%
23
0.84%
1,324
48.27%
2,743
Holt
3,746
54.43%
3,126
45.42%
10
0.15%
620
9.01%
6,882
Hooker
355
76.02%
110
23.55%
2
0.43%
245
52.46%
467
Howard
1,937
46.60%
2,197
52.85%
23
0.55%
-260
-6.25%
4,157
Jefferson
4,359
65.96%
2,193
33.18%
57
0.86%
2,166
32.77%
6,609
Johnson
2,632
63.67%
1,485
35.92%
17
0.41%
1,147
27.75%
4,134
Kearney
2,426
68.28%
1,093
30.76%
34
0.96%
1,333
37.52%
3,553
Keith
1,715
67.10%
832
32.55%
9
0.35%
883
34.55%
2,556
Keya Paha
989
79.76%
232
18.71%
19
1.53%
757
61.05%
1,240
Kimball
1,296
74.01%
438
25.01%
17
0.97%
858
49.00%
1,751
Knox
3,668
55.46%
2,914
44.06%
32
0.48%
754
11.40%
6,614
Lancaster
30,523
75.17%
9,840
24.23%
242
0.60%
20,683
50.94%
40,605
Lincoln
5,946
70.58%
2,381
28.26%
98
1.16%
3,565
42.31%
8,425
Logan
595
74.38%
195
24.38%
10
1.25%
400
50.00%
800
Loup
594
83.78%
106
14.95%
9
1.27%
488
68.83%
709
Madison
6,229
64.32%
3,407
35.18%
48
0.50%
2,822
29.14%
9,684
McPherson
419
84.31%
69
13.88%
9
1.81%
350
70.42%
497
Merrick
3,269
69.57%
1,403
29.86%
27
0.57%
1,866
39.71%
4,699
Morrill
2,318
74.27%
765
24.51%
38
1.22%
1,553
49.76%
3,121
Nance
2,299
63.28%
1,318
36.28%
16
0.44%
981
27.00%
3,633
Nemaha
3,777
68.08%
1,767
31.85%
4
0.07%
2,010
36.23%
5,548
Nuckolls
3,299
65.63%
1,684
33.50%
44
0.88%
1,615
32.13%
5,027
Otoe
5,063
62.68%
2,959
36.63%
55
0.68%
2,104
26.05%
8,077
Pawnee
2,825
64.29%
1,547
35.21%
22
0.50%
1,278
29.09%
4,394
Perkins
1,461
69.37%
631
29.96%
14
0.66%
830
39.41%
2,106
Phelps
3,297
77.56%
927
21.81%
27
0.64%
2,370
55.75%
4,251
Pierce
2,542
61.45%
1,586
38.34%
9
0.22%
956
23.11%
4,137
Platte
3,435
41.84%
4,748
57.83%
27
0.33%
-1,313
-15.99%
8,210
Polk
3,096
67.17%
1,494
32.41%
19
0.41%
1,602
34.76%
4,609
Red Willow
3,559
66.10%
1,770
32.88%
55
1.02%
1,789
33.23%
5,384
Richardson
5,833
65.09%
3,072
34.28%
57
0.64%
2,761
30.81%
8,962
Rock
1,034
77.11%
305
22.74%
2
0.15%
729
54.36%
1,341
Saline
3,347
45.67%
3,955
53.97%
26
0.35%
-608
-8.30%
7,328
Sarpy
2,011
51.04%
1,900
48.22%
29
0.74%
111
2.82%
3,940
Saunders
5,356
58.31%
3,793
41.29%
37
0.40%
1,563
17.02%
9,186
Scotts Bluff
6,677
81.76%
1,403
17.18%
87
1.07%
5,274
64.58%
8,167
Seward
3,539
59.68%
2,367
39.92%
24
0.40%
1,172
19.76%
5,930
Sheridan
3,030
70.22%
1,226
28.41%
59
1.37%
1,804
41.81%
4,315
Sherman
1,675
48.76%
1,733
50.45%
27
0.79%
-58
-1.69%
3,435
Sioux
1,178
72.54%
435
26.79%
11
0.68%
743
45.75%
1,624
Stanton
1,211
48.17%
1,296
51.55%
7
0.28%
-85
-3.38%
2,514
Thayer
3,552
61.80%
2,173
37.80%
23
0.40%
1,379
23.99%
5,748
Thomas
406
72.24%
152
27.05%
4
0.71%
254
45.20%
562
Thurston
1,538
45.33%
1,837
54.14%
18
0.53%
-299
-8.81%
3,393
Valley
2,768
69.27%
1,205
30.16%
23
0.58%
1,563
39.11%
3,996
Washington
2,750
58.71%
1,912
40.82%
22
0.47%
838
17.89%
4,684
Wayne
2,354
64.88%
1,235
34.04%
39
1.07%
1,119
30.84%
3,628
Webster
2,924
68.22%
1,342
31.31%
20
0.47%
1,582
36.91%
4,286
Wheeler
534
64.18%
293
35.22%
5
0.60%
241
28.97%
832
York
5,769
74.16%
1,979
25.44%
31
0.40%
3,790
48.72%
7,779
Totals
345,745
63.19%
197,959
36.18%
3,434
0.63%
147,786
27.01%
547,144
See also
Notes
References
"Dave Leip's Atlas of U.S. Presidential Elections" . uselectionatlas.org . Retrieved March 4, 2020.^ "NE US President Race, November 06, 1928" . Our Campaigns.
Categories :
Text is available under the Creative Commons Attribution-ShareAlike License. Additional terms may apply.
**DISCLAIMER** We are not affiliated with Wikipedia, and Cloudflare.
The information presented on this site is for general informational purposes only and does not constitute medical advice.
You should always have a personal consultation with a healthcare professional before making changes to your diet, medication, or exercise routine.
AI helps with the correspondence in our chat.
We participate in an affiliate program. If you buy something through a link, we may earn a commission 💕
↑
 County Results


