Main article: 1928 United States presidential election
The 1928 United States presidential election in South Dakota took place on November 6, 1928, as part of the 1928 United States presidential election which was held throughout all contemporary 48 states. Voters chose five representatives, or electors to the Electoral College , who voted for president and vice president .
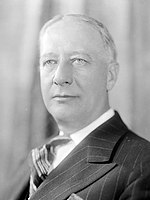
Ever since statehood South Dakota had been solidly Republican apart from when supporting Populist -backed William Jennings Bryan by an exceedingly narrow 0.22% margin in 1896 . However, the state had been one of the strongest for insurgent Robert M. La Follette senior in 1924 , and after La Follette died six months following that election his family would endorse New York City Catholic Democrat Al Smith rather than any Republican.
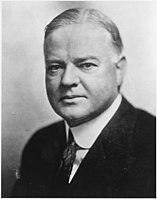
In the more Catholic states of North Dakota and Wisconsin, this endorsement would have a major effect in reviving a largely moribund Democratic Party at a presidential level, although it was not adequate to give Smith those states’ electoral votes. In less Catholic and more Ozark -settled and Methodist South Dakota, anti-Catholicism was a powerful force in most areas and as a result Smith's gain on Davis’ vote was much less, with the exception of a few powerfully pro-La Follette German Lutheran counties whose voters were lured by Smith's opposition to Prohibition . Armstrong County , a sparsely-populated part of an Indian reservation, cast all 7 of its votes for Smith, setting a record for the nation. Smith was the first ever Democrat to win McPherson County , but South Dakota still voted for Republican nominee Herbert Hoover by a margin of 20.98%, which made it 3.56% more Republican than the nation at-large in a major landslide.
Results
Results by county
County
Herbert Clark Hoover
Alfred Emmanuel Smith
Frank E. Webb
Norman Mattoon Thomas
William Z. Foster
Margin
Total votes cast
#
%
#
%
#
%
#
%
#
%
#
%
Armstrong
0
0.00%
7
100.00%
0
0.00%
0
0.00%
0
0.00%
-7
-100.00%
7
Aurora
1,552
51.72%
1,426
47.52%
14
0.47%
7
0.23%
2
0.07%
126
4.20%
3,001
Beadle
5,094
61.43%
3,168
38.20%
17
0.20%
12
0.14%
2
0.02%
1,926
23.22%
8,293
Bennett
766
58.16%
544
41.31%
4
0.30%
2
0.15%
1
0.08%
222
16.86%
1,317
Bon Homme
2,262
50.93%
2,166
48.77%
6
0.14%
7
0.16%
0
0.00%
96
2.16%
4,441
Brookings
4,586
70.05%
1,915
29.25%
42
0.64%
4
0.06%
0
0.00%
2,671
40.80%
6,547
Brown
7,266
58.03%
5,065
40.45%
67
0.54%
48
0.38%
76
0.61%
2,201
17.58%
12,522
Brule
1,431
46.46%
1,599
51.92%
15
0.49%
28
0.91%
7
0.23%
-168
-5.45%
3,080
Buffalo
405
51.01%
387
48.74%
2
0.25%
0
0.00%
0
0.00%
18
2.27%
794
Butte
1,988
69.36%
840
29.31%
11
0.38%
6
0.21%
21
0.73%
1,148
40.06%
2,866
Campbell
1,346
69.13%
588
30.20%
8
0.41%
4
0.21%
1
0.05%
758
38.93%
1,947
Charles Mix
3,087
50.28%
3,039
49.50%
6
0.10%
2
0.03%
6
0.10%
48
0.78%
6,140
Clark
2,665
65.46%
1,370
33.65%
30
0.74%
5
0.12%
1
0.02%
1,295
31.81%
4,071
Clay
2,573
63.42%
1,474
36.33%
10
0.25%
0
0.00%
0
0.00%
1,099
27.09%
4,057
Codington
3,762
53.08%
3,299
46.55%
21
0.30%
4
0.06%
1
0.01%
463
6.53%
7,087
Corson
1,847
56.92%
1,374
42.34%
11
0.34%
10
0.31%
3
0.09%
473
14.58%
3,245
Custer
1,464
66.85%
715
32.65%
9
0.41%
2
0.09%
0
0.00%
749
34.20%
2,190
Davison
3,821
58.15%
2,729
41.53%
12
0.18%
9
0.14%
0
0.00%
1,092
16.62%
6,571
Day
3,180
54.22%
2,642
45.05%
28
0.48%
11
0.19%
4
0.07%
538
9.17%
5,865
Deuel
1,869
64.40%
999
34.42%
22
0.76%
9
0.31%
3
0.10%
870
29.98%
2,902
Dewey
1,293
56.39%
996
43.44%
2
0.09%
2
0.09%
0
0.00%
297
12.95%
2,293
Douglas
1,949
68.68%
879
30.97%
6
0.21%
2
0.07%
2
0.07%
1,070
37.70%
2,838
Edmunds
1,743
51.95%
1,597
47.60%
7
0.21%
5
0.15%
3
0.09%
146
4.35%
3,355
Fall River
2,216
63.51%
1,258
36.06%
9
0.26%
6
0.17%
0
0.00%
958
27.46%
3,489
Faulk
1,907
62.46%
1,135
37.18%
3
0.10%
6
0.20%
2
0.07%
772
25.29%
3,053
Grant
2,508
59.49%
1,656
39.28%
29
0.69%
17
0.40%
6
0.14%
852
20.21%
4,216
Gregory
2,274
53.04%
2,001
46.68%
10
0.23%
2
0.05%
0
0.00%
273
6.37%
4,287
Haakon
1,255
64.33%
663
33.98%
25
1.28%
6
0.31%
2
0.10%
592
30.34%
1,951
Hamlin
1,959
63.19%
1,088
35.10%
34
1.10%
5
0.16%
14
0.45%
871
28.10%
3,100
Hand
2,430
63.26%
1,397
36.37%
7
0.18%
7
0.18%
0
0.00%
1,033
26.89%
3,841
Hanson
1,576
58.13%
1,129
41.65%
3
0.11%
3
0.11%
0
0.00%
447
16.49%
2,711
Harding
1,032
72.78%
368
25.95%
12
0.85%
3
0.21%
3
0.21%
664
46.83%
1,418
Hughes
1,912
61.56%
1,171
37.70%
16
0.52%
4
0.13%
3
0.10%
741
23.86%
3,106
Hutchinson
2,145
52.61%
1,898
46.55%
26
0.64%
2
0.05%
6
0.15%
247
6.06%
4,077
Hyde
960
60.80%
608
38.51%
7
0.44%
3
0.19%
1
0.06%
352
22.29%
1,579
Jackson
704
62.63%
417
37.10%
2
0.18%
1
0.09%
0
0.00%
287
25.53%
1,124
Jerauld
1,517
62.69%
875
36.16%
15
0.62%
13
0.54%
0
0.00%
642
26.53%
2,420
Jones
857
66.43%
422
32.71%
5
0.39%
5
0.39%
1
0.08%
435
33.72%
1,290
Kingsbury
3,499
71.88%
1,352
27.77%
15
0.31%
2
0.04%
0
0.00%
2,147
44.10%
4,868
Lake
3,048
63.41%
1,744
36.28%
15
0.31%
0
0.00%
0
0.00%
1,304
27.13%
4,807
Lawrence
4,141
69.63%
1,785
30.02%
17
0.29%
4
0.07%
0
0.00%
2,356
39.62%
5,947
Lincoln
3,463
71.40%
1,364
28.12%
14
0.29%
9
0.19%
0
0.00%
2,099
43.28%
4,850
Lyman
1,488
54.75%
1,222
44.96%
5
0.18%
3
0.11%
0
0.00%
266
9.79%
2,718
Marshall
1,858
57.13%
1,315
40.44%
73
2.24%
4
0.12%
2
0.06%
543
16.70%
3,252
McCook
2,234
55.78%
1,758
43.90%
10
0.25%
3
0.07%
0
0.00%
476
11.89%
4,005
McPherson
1,234
45.52%
1,468
54.15%
6
0.22%
2
0.07%
1
0.04%
-234
-8.63%
2,711
Meade
2,845
66.04%
1,441
33.45%
11
0.26%
10
0.23%
1
0.02%
1,404
32.59%
4,308
Mellette
943
50.13%
927
49.28%
5
0.27%
6
0.32%
0
0.00%
16
0.85%
1,881
Miner
1,990
59.37%
1,341
40.01%
13
0.39%
7
0.21%
1
0.03%
649
19.36%
3,352
Minnehaha
13,741
66.68%
6,805
33.02%
35
0.17%
20
0.10%
7
0.03%
6,936
33.66%
20,608
Moody
2,108
59.63%
1,416
40.06%
5
0.14%
4
0.11%
2
0.06%
692
19.58%
3,535
Pennington
4,645
66.97%
2,266
32.67%
9
0.13%
10
0.14%
6
0.09%
2,379
34.30%
6,936
Perkins
2,262
68.57%
1,010
30.62%
12
0.36%
11
0.33%
4
0.12%
1,252
37.95%
3,299
Potter
1,240
52.77%
1,100
46.81%
6
0.26%
2
0.09%
2
0.09%
140
5.96%
2,350
Roberts
2,966
52.73%
2,619
46.56%
26
0.46%
7
0.12%
7
0.12%
347
6.17%
5,625
Sanborn
1,576
54.08%
1,321
45.33%
12
0.41%
4
0.14%
1
0.03%
255
8.75%
2,914
Shannon
469
43.63%
601
55.91%
2
0.19%
3
0.28%
0
0.00%
-132
-12.28%
1,075
Spink
3,868
60.89%
2,451
38.59%
16
0.25%
14
0.22%
3
0.05%
1,417
22.31%
6,352
Stanley
736
62.32%
437
37.00%
1
0.08%
6
0.51%
1
0.08%
299
25.32%
1,181
Sully
999
70.50%
415
29.29%
3
0.21%
0
0.00%
0
0.00%
584
41.21%
1,417
Todd
789
48.43%
831
51.01%
7
0.43%
2
0.12%
0
0.00%
-42
-2.58%
1,629
Tripp
2,396
53.02%
2,099
46.45%
10
0.22%
14
0.31%
0
0.00%
297
6.57%
4,519
Turner
3,362
70.65%
1,380
29.00%
10
0.21%
5
0.11%
2
0.04%
1,982
41.65%
4,759
Union
2,415
53.19%
2,106
46.39%
5
0.11%
9
0.20%
5
0.11%
309
6.81%
4,540
Walworth
1,854
59.96%
1,216
39.33%
15
0.49%
5
0.16%
2
0.06%
638
20.63%
3,092
Washabaugh
294
50.69%
282
48.62%
3
0.52%
1
0.17%
0
0.00%
12
2.07%
580
Washington
205
47.34%
228
52.66%
0
0.00%
0
0.00%
0
0.00%
-23
-5.31%
433
Yankton
2,971
50.88%
2,841
48.66%
14
0.24%
9
0.15%
4
0.07%
130
2.23%
5,839
Ziebach
759
55.00%
615
44.57%
2
0.14%
3
0.22%
1
0.07%
144
10.43%
1,380
Totals
157,603
60.19%
102,660
39.20%
927
0.35%
443
0.17%
224
0.09%
54,943
20.98%
261,857
See also
References
Phillips, Kevin P. ; The Emerging Republican Majority , p. 418 ISBN 9780691163246
The Geography of Presidential Elections in the United States, 1868-2004 , p. 59 ISBN 0786422173
The Emerging Republican Majority , pp. 420, 425
The Emerging Republican Majority , p. 426
Last Call: The Rise and Fall of Prohibition , p. 309 ISBN 9781464023255
"Armstrong County in South Dakota Voted Solidly for Al Smith" . The Leader-Times . Vol. 40, no. 22. Kittaning, Pennsylvania. November 26, 1928. p. 1. Retrieved March 10, 2023 – via Newspapers.com.The Geography of Presidential Elections in the United States , pp. 294-298
Dave Leip. "1928 Presidential General Election Results – South Dakota" . Dave Leip’s U.S. Election Atlas.
SD US Presidential Election Race, November 06, 1928
Categories :
Text is available under the Creative Commons Attribution-ShareAlike License. Additional terms may apply.
**DISCLAIMER** We are not affiliated with Wikipedia, and Cloudflare.
The information presented on this site is for general informational purposes only and does not constitute medical advice.
You should always have a personal consultation with a healthcare professional before making changes to your diet, medication, or exercise routine.
AI helps with the correspondence in our chat.
We participate in an affiliate program. If you buy something through a link, we may earn a commission 💕
↑
 County Results


