Main article: 1948 United States presidential election
1948 United States presidential election in South Dakota South Dakota votes to the Electoral College
Dewey
40-50%
50-60%
60-70%
70-80%
Truman
40-50%
50-60%
60-70%
80-90%
Tie
40–50% (Dewey and Truman)
The 1948 United States presidential election in South Dakota took place on November 2, 1948, as part of the 1948 United States presidential election . Voters chose four representatives, or electors, to the Electoral College , who voted for president and vice president .
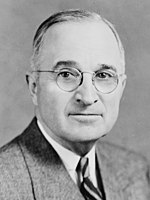
South Dakota was won by Governor Thomas E. Dewey (R –New York ), running with Governor Earl Warren , with 51.84% of the popular vote, against incumbent President Harry S. Truman (D –Missouri ), running with Senator Alben W. Barkley , with 47.04% of the popular vote.
Results
Results by county
County
Thomas E. Dewey
Harry S. Truman
Henry Wallace
Margin
Total votes cast
#
%
#
%
#
%
#
%
Armstrong
1
14.29%
6
85.71%
0
0.00%
-5
-71.43%
7
Aurora
1,056
45.30%
1,275
54.70%
16
0.69%
-219
-9.40%
2,331
Beadle
3,662
45.58%
4,372
54.42%
77
0.96%
-710
-8.84%
8,034
Bennett
477
38.62%
758
61.38%
17
1.38%
-281
-22.75%
1,235
Bon Homme
2,283
52.36%
2,077
47.64%
48
1.10%
206
4.72%
4,360
Brookings
3,975
57.76%
2,907
42.24%
44
0.64%
1,068
15.52%
6,882
Brown
5,632
44.07%
7,148
55.93%
192
1.50%
-1,516
-11.86%
12,780
Brule
1,056
38.48%
1,646
59.99%
42
1.53%
-590
-21.51%
2,744
Buffalo
313
48.38%
334
51.62%
5
0.77%
-21
-3.25%
647
Butte
1,726
61.84%
1,065
38.16%
51
1.83%
661
23.68%
2,791
Campbell
1,518
78.05%
410
21.08%
17
0.87%
1,108
56.97%
1,945
Charles Mix
1,800
36.47%
3,086
62.53%
49
0.99%
-1,286
-26.06%
4,935
Clark
1,625
50.59%
1,559
48.54%
28
0.87%
66
2.05%
3,212
Clay
2,228
51.09%
2,080
47.70%
53
1.22%
148
3.39%
4,361
Codington
3,349
45.01%
4,042
54.32%
50
0.67%
-693
-9.31%
7,441
Corson
1,154
49.63%
1,154
49.63%
17
0.73%
0
0.00%
2,325
Custer
1,217
56.66%
917
42.69%
14
0.65%
300
13.97%
2,148
Davison
2,996
42.03%
4,064
57.01%
68
0.95%
-1,068
-14.98%
7,128
Day
2,438
42.91%
3,146
55.38%
97
1.71%
-708
-12.46%
5,681
Deuel
1,357
49.91%
1,324
48.69%
38
1.40%
33
1.21%
2,719
Dewey
864
53.80%
727
45.27%
15
0.93%
137
8.53%
1,606
Douglas
1,301
63.71%
736
36.04%
5
0.24%
565
27.67%
2,042
Edmunds
1,493
54.00%
1,253
45.32%
19
0.69%
240
8.68%
2,765
Fall River
2,037
59.72%
1,348
39.52%
26
0.76%
689
20.20%
3,411
Faulk
1,054
51.49%
971
47.44%
22
1.07%
83
4.05%
2,047
Grant
1,972
48.57%
2,052
50.54%
36
0.89%
-80
-1.97%
4,060
Gregory
1,723
48.37%
1,793
50.34%
46
1.29%
-70
-1.97%
3,562
Haakon
753
57.92%
519
39.92%
28
2.15%
234
18.00%
1,300
Hamlin
1,608
53.98%
1,326
44.51%
45
1.51%
282
9.47%
2,979
Hand
1,402
50.47%
1,367
49.21%
9
0.32%
35
1.26%
2,778
Hanson
860
47.05%
953
52.13%
15
0.82%
-93
-5.09%
1,828
Harding
529
50.87%
479
46.06%
32
3.08%
50
4.81%
1,040
Hughes
1,739
61.43%
1,080
38.15%
12
0.42%
659
23.28%
2,831
Hutchinson
2,906
70.01%
1,209
29.13%
36
0.87%
1,697
40.88%
4,151
Hyde
817
59.25%
553
40.10%
9
0.65%
264
19.14%
1,379
Jackson
432
56.40%
321
41.91%
13
1.70%
111
14.49%
766
Jerauld
1,085
54.60%
876
44.09%
26
1.31%
209
10.52%
1,987
Jones
522
55.06%
414
43.67%
12
1.27%
108
11.39%
948
Kingsbury
2,332
62.55%
1,338
35.89%
58
1.56%
994
26.66%
3,728
Lake
2,837
56.95%
2,093
42.01%
52
1.04%
744
14.93%
4,982
Lawrence
3,778
62.50%
2,209
36.54%
58
0.96%
1,569
25.96%
6,045
Lincoln
2,771
59.51%
1,826
39.22%
59
1.27%
945
20.30%
4,656
Lyman
993
51.94%
904
47.28%
15
0.78%
89
4.65%
1,912
Marshall
1,419
44.37%
1,710
53.47%
69
2.16%
-291
-9.10%
3,198
McCook
2,064
59.46%
1,387
39.96%
20
0.58%
677
19.50%
3,471
McPherson
2,034
76.24%
611
22.90%
23
0.86%
1,423
53.34%
2,668
Meade
2,053
54.47%
1,681
44.60%
35
0.93%
372
9.87%
3,769
Mellette
482
49.33%
482
49.33%
13
1.33%
0
0.00%
977
Miner
1,188
45.92%
1,373
53.07%
26
1.01%
-185
-7.15%
2,587
Minnehaha
14,047
53.77%
11,770
45.05%
308
1.18%
2,277
8.72%
26,125
Moody
1,691
50.19%
1,630
48.38%
48
1.42%
61
1.81%
3,369
Pennington
6,392
56.01%
4,929
43.19%
92
0.81%
1,463
12.82%
11,413
Perkins
1,424
55.04%
1,096
42.37%
67
2.59%
328
12.68%
2,587
Potter
1,044
49.69%
1,039
49.45%
18
0.86%
5
0.24%
2,101
Roberts
2,211
39.12%
3,277
57.98%
164
2.90%
-1,066
-18.86%
5,652
Sanborn
990
48.03%
1,046
50.75%
25
1.21%
-56
-2.72%
2,061
Shannon
641
44.09%
803
55.23%
10
0.69%
-162
-11.14%
1,454
Spink
2,310
45.59%
2,702
53.33%
55
1.09%
-392
-7.74%
5,067
Stanley
522
58.85%
359
40.47%
6
0.68%
163
18.38%
887
Sully
579
58.37%
405
40.83%
8
0.81%
174
17.54%
992
Todd
625
43.46%
796
55.35%
17
1.18%
-171
-11.89%
1,438
Tripp
1,845
48.32%
1,918
50.24%
55
1.44%
-73
-1.91%
3,818
Turner
3,048
66.26%
1,514
32.91%
38
0.83%
1,534
33.35%
4,600
Union
2,205
49.38%
2,237
50.10%
23
0.52%
-32
-0.72%
4,465
Walworth
1,607
50.94%
1,513
47.96%
35
1.11%
94
2.98%
3,155
Washabaugh
192
45.82%
223
53.22%
4
0.95%
-31
-7.40%
419
Yankton
2,904
49.28%
2,932
49.75%
57
0.97%
-28
-0.48%
5,893
Ziebach
463
47.24%
503
51.33%
14
1.43%
-40
-4.08%
980
Totals
129,651
51.84%
117,653
47.04%
2,801
1.12%
11,998
4.80%
250,105
Counties that flipped from Republican to Democratic
See also
References
"United States Presidential election of 1948 - Encyclopædia Britannica" . Retrieved December 20, 2017."1948 Election for the Forty-First Term (1949-53)" . Retrieved December 20, 2017."1948 Presidential General Election Results - South Dakota" . Retrieved December 20, 2017."The American Presidency Project – Election of 1948" . Retrieved December 20, 2017.America at the Polls: A Handbook of Presidential Election Statistics 1920-1964 ; pp. 406-407 ISBN 0405077114
Categories :
Text is available under the Creative Commons Attribution-ShareAlike License. Additional terms may apply.
**DISCLAIMER** We are not affiliated with Wikipedia, and Cloudflare.
The information presented on this site is for general informational purposes only and does not constitute medical advice.
You should always have a personal consultation with a healthcare professional before making changes to your diet, medication, or exercise routine.
AI helps with the correspondence in our chat.
We participate in an affiliate program. If you buy something through a link, we may earn a commission 💕
↑
 County Results


